Download
1 / 33
330 likes | 406 Views
The statistical analysis of acoustic correlates of speech rhythm. 1. Introduction. Data description: two corpora

E N D
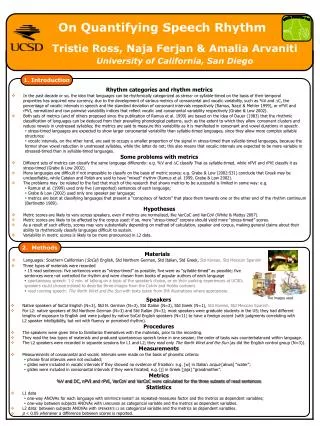
The statistical analysis of acoustic correlates of speech rhythm
1. Introduction • Data description: two corpora • “20 sentences”: 20 sentences spoken three times by two female native speakers of BP and EP ( segmented by Flaviane R. Fernandes and Janaisa M. Viscardi) • “RNM”: 20 sentences of each of : English, Polish, Dutch, French, Spanish, Catalan, Italian, Japanese 5 sentences uttered by each of 4 female speakers
Purposes • Apply the RNM approach to the enlarged data set. • Present alternative descriptive statistical measures • Analize the effect of dropping the last vocalic interval of each sentence. • Introduce a probalility model for duration, which allows for improved descriptions and hypothesis testing • Use this model to give statistical support to the rhythmic class hypothesis
The RNM statistics For each sentence of the corpus the following are computed: DC, DV= standard deviation for vocalic and consonantal intervals %V= proportion of time spent on vocalic intervals Values are averaged for each speaker
3. Alternative analysis • 3.1 Dropping the last vocalic interval • The last vocalic interval is an important source of variability. • It was obserded that in BP and EP there is a stretching in final vocalic intervals. • New data set: omitting the last vocalic interval for each language, and also the subsequent consonantal interval, if one exists.
Locationof BP and EP speakers in the %V vs. DC Plane – complete sentences
The effect of the last vocalic interval in BP and EP- individual values
3.2 Robust statistics “Robust”= insensive to extreme values Simplest robust measure of location: replace the mean by the median. To find the median of a set of numbers: sort them and pick the one in the middle Simplest robust measure of dispersion: replace the standard deviation by the median absolute deviation(MAD).
4. A probability model for duration • Former analysis is descriptive Finding a parametric family of probability distributions that fits the data closely would have two advantages: • May yield a better description of data • Allows us to make inference, i. e., to extend results from the “sample” (the data set) to the “population” ( the set of all potential setences)
Severaldistributionstried: Log-normal, Weibull, exponential, Gamma The Gamma was the best fit :quantile-quantile (QQplot)- Given a data set and a theoretical, plot the quantiles of the latter vs those of the empirical distribution
Gamma distribution It has two parameters:a and b, controlling shape and size, respectively: small a: high asymmetry; a = 1 gives the the exponential distribution; Large a approximates the normal. The parameters are related to the mean m and standard deviation s by m=ab s2=ab2
5. Hypothesis testing In view of the close relationship between a and b , we may use one of the two, or one function of both, to represent relevant features. Based on the RNM results, we choose the model standard deviation : â=ÒÑ1/2
Standard deviation of Gamma for the ten languages – complete sentences
Rhythmic class hypothesis • We represent the rhythmic class hypothesis by the following statistical model: • 1.The syllabic languages ( Italian, Spanish, French, Catalan , BP) have the same standard deviation, say, s1. • 2.The accentual ones (Polish, Dutch, English, EP) share another, say, s2 • 3. s1, s2and the standard deviation for Japanese s3 are different .
Results To test the model, we first tested (1) and (2) by means of the Likelihood Ratio Test, which yielded a p-value of 0.91, which means that the equality of s's within rhythmic classes is highly compatible with the data ( a small p-value indicates rejection). Then we tested the null hypothesis that some of s1 , s2, s3 are equal, which was rejected with a p-value of 0.0012, thus giving statistical evidence that the three are different.
Acknowledgments We want to thank Franck Ramus, Marina Nespor and Jacques Mehler, who generously made their unpublished data avalaible to us. Wealso thankJanaisa Viscardi and Flaviane Fernandes for the segmentation of the acoustic data
The “20 sentences” corpus The following sentences of the corpus 20 sentences were considered in the statistical analysis. The choice was based on the quality of acoustic signal and to avoid dubious cases of labeling. 1. A moderniza₤₧o foi satisfatória. 5. A falta de moderniza₤₧o ₫ catastrófica. 6. O trabalho da pesquisadora foi publicado. 8. O governador aceitou a moderniza₤₧o. 9. A falta de autoridade foi alarmante. 11. A catalogadora compreendeu o trabalho da pesquisadora. 12. A professora discutiu a gramaticalidade. 15. A procura da gramaticalidade ₫ o nosso objetivo. 16. A pesquisadora perdeu autoridade. 18. A autoridade cabe ao governador. 20. A gramaticalidade das frases foi conseguida.
Grants supporting the research FAPESP grant n. 98/3382-0 (Projeto Temático Rhythmic patterns, parameter setting and language change ) PRONEX grant 66.2177/1996-6 (Núcleo de Excel₨ncia Critical phenomena in probability and stochastic processes) CNPq grant 465928/2000-5 (Probabilistic tools for pattern identification applied to linguistics)
Related papers and references Abercrombie, D. (1967). Elements of general phonetics. Chicago: Aldine. Grabe, E. and Low, E., L. (2000) Acoustic correlates in rhythmic class. Paper presented at the 7th conference on laboratory phonology, Nijmegen. Lloyd, J. (1940) Speech signal in telephony. London. Mehler, J., Jusczyk, P., Dehane-Lambertz, G., Bertoncini, N. And Amiel-Tison, C. (1988) A percursor of language acquisition in young infants. Cognition 29: 143-178. Nazzi, T., Bertoncini, N. and Mehler, J. ( 1998) Language discrimination by newborns towads an understanding of the role of the rhythm. Journal of experimental psychology: human perception and perfomance 24 (3): 756-766. Nespor, M. (1990) On the rhythm parameter in phonology. Logical issues in language acquisition, Iggy Roca , 157-175. Ramus, F. And Mehler, J. ( 1999). Language acquisition with suprasegmental cues: a study based on speecch resynthesis. JASA 105: 512-521. Ramus, F., Nespor, M. and Mehler (1999) Correlates of linguistic rhythm in speech. Cognition 73: 265-292. Frota, S. and Vigário, M.(2001) On the correlates of rhythm distinctions: the European/ Brazilian Portuguese case. To be published in Probus.
Appendix: the meaning of a p-value Consider the situation of testing a statistical hypothesis: To fix ideas, suppose that we have samples from two populations, and we want to test the hypothesis that both have the same (unknown) mean. Of course, even if the hypothesis is true, the two sample means will be different, due to sampling variability. To test the hypothesis, we compute a number T from our data (the so-called “test statistics”) which measures the discrepancy between the data and the hypothesis. In our example T will depend on the differences between the sample means. If T is very large, we have a statistical evidence against the hypothesis. What is a rational definition of “large”?
Suppose our data yields T=3.5; and that we compute the probability p that, if the hypothesis is true, we obtain a value of T greater than 3.5. This the so-called “p-value” of the test. If, say, p= 0.002, this means that, if the means are equal, we would be observing an exceptionally large value ( since a larger one is observed only with probability 0.2%); Thus we would have grounds to reject the hypothesis.