Download
1 / 15
150 likes | 154 Views
The FiRe CTO Design Challenge: Wildfire Technology. Hosted by David Brin Per-Kristian Halvorsen, Intuit Brian Higbee, Symantec Kevin Walter, EMC Kelly Millsaps, Avanade Ty Carlson, Microsoft Simon Bisson, Journalist John Graham, SDSU Larry Smarr, Calit2 Robert Twomey, CRCA

E N D
The FiRe CTO Design Challenge:Wildfire Technology Hosted by David Brin Per-Kristian Halvorsen, Intuit Brian Higbee, Symantec Kevin Walter, EMC Kelly Millsaps, Avanade Ty Carlson, Microsoft Simon Bisson, Journalist John Graham, SDSU Larry Smarr, Calit2 Robert Twomey, CRCA Ron Roberts, SD County Supervisor William Metcalf, Fire Chief Ron Lane, SD OES May 23, 2008
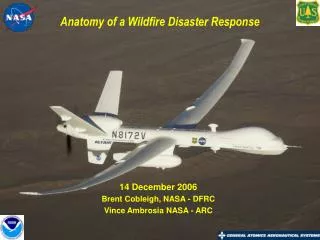
Problem Statement Situational Awareness Early Detection Rapid Response • Focus on Fire Storms--Wildfires Driven by Santa Anna Winds • Questions Posed by Fire Professionals: • Where is the Fire Now? • Where is it Going? • When Will it Get there? • Objectives: • Situational Awareness • Early Detection • Rapid Response • Benefits • Save Lives • Save Property • Reduce Insurance Costs • Improve Building Codes • Slow Climate Change (Prevent Liberation of Sequestered Carbon)
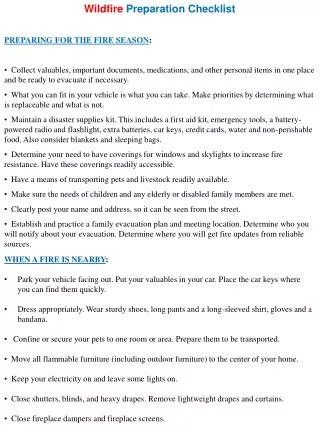
Early Detection • Goal • Ignition To Detection In Less Than 5 Minutes • Today Detection ~30 Minutes Day, 1-2 Hours Night • Phone Call • Email • Ham operator • Fire Detection Grid Integrated Into Control Center • Leverage/Integrate HPWREN Mountain-Top Weather Stations (Wind, Temp, RH) • Environmentally Harden Detection Components • Aerostat Balloons, NASA Helios as County-Wide Multi-Spectral Platform • Infrared, Smoke, Radar, Etc. • Automated Event Recognition & Location • Real-time Data Feeds To Control Center • #FIRE Mobile GSM Tagged Notification • Channel 0 on Family Band Radio (FRS) • Monitor Electric, Fiber Optic, And Phone Lines For Vibration
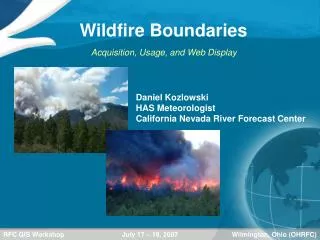
FIRESNet: Fire Informatics and Realtime Environmental Sensor Network Angora Ridge fire June 25, 2007 • Wireless System • Local (30 Mb/s) • Back to UC Riverside • Over CENIC to others • Sensors Include: • High-Res Cameras • All Visible • Some IR • Met-Stations • Particulate Sensors • Seismometers Proposal Under review: UCSD, VCR, UCD Source: Graham Kent, SIO, UCSD
MODIS Images Provide Targeting Information to NASA's EO-1 Satellite Which Cuts Through Smoke Composite of the Red, Blue, and Green Channels Three of the Shortwave Infrared Channels October 23, 2007 Witch Wildfire south of Escondido, California EO-1’s Hyperion Spectrometer Observes 220 Contiguous Wavelengths From Visible Light To Shortwave Infrared NASA/EO-1 Teamwww.nasa.gov/vision/earth/lookingatearth/socal_wildfires_oct07.html
Rapid Response Result: Accurate & Coordinated Real Time Resource Management • Challenge • Rice Fire of 2007 • Instant Detection • 5 Minute Response Time • When Responders Arrived, Fire Was ~ 50 Acres In Size • Fire Grew to 10,000 Acres Before Containment • Recommendations • Tankers, Predators on Standby • Attempt to Retard Fire • GPS Coordinates from Early Detection • Simulation Models to Predict Path/Behavior of Fire • Pre-Position Resources • Scatter Ping Pong Sensors Ahead of Projected Path • Early Grounding of Shorts During Peak Risk Periods • SMS Message Emergency Push Capability
Situational Awareness • Modeling of firestorm scenarios for training in advance of event • Repurpose and customize LANL models for San Diego • Simulation “war games” for training • Real time prediction • Triage • Resource re-deployment • Update policies based on modeling output • Current state integrated in a GEO-referenced framework • Data Inputs: GIS, GPS, wind flow field, temperature, humidity, fuel load (hyperspectral & IFSAR imaging) , topology, event (fire) location, Fire Fighting personnel & resources, power lines, roads, water supplies, homes/property, CERT and civilian sources, News Media, aerial platform imagery • Output: GIS layers integrated into the EOC, data federation based on role (emergency personnel, public, etc.) • Mutual Aid Service: GIS/GSM integration into situational awareness • Early Detection • Monitor electric, fiber optic, and phone lines for vibration
NASA’s Aqua Satellite’s MODIS Instrument Provided “Situational Awareness” of the 14 SoCal Fires Calit2, SDSU, and NASA Goddard Used NASA Prioritization and OptIPuter Links to Cut time to Receive Images from 24 to 3 Hours October 22, 2007 Moderate Resolution Imaging Spectroradiometer (MODIS) NASA/MODIS Rapid Responsewww.nasa.gov/vision/earth/lookingatearth/socal_wildfires_oct07.html
SDSU’s San Diego GIS Force Group of Volunteers Geo-Referenced MODIS Data and Distributed Over Web “We apologize for the slow server performance in the first two days of the wildfires (Oct. 21 & 22) due to overloaded requests from Web users. Tuesday we were given access to major Intel computers at Calit2 at UCSD and special connectivity between SDSU and UCSD (OptIPuter) from which this page is now being served (special thanks to John Graham, Eric Frost, Larry Smarr, John DeNune, and Cristiano). It is super fast now.” -- SDSU Department of Geography, Oct. 25, 11:00am. October 23, 2007 Site organized by Dr. Ming-Hsiang Tsou, SDSU http://map.sdsu.edu/
Communications • Fire & Emergency Personnel • Enhanced Data Capabilities • Extend to Individual Actors • Current State Data on Fire: Location, Predicted Path & Timing • GIS Integrated View of Resource Locations • Public • Current State Data on Fire • Evacuation Planning and Execution • News and Media Feeds • SDSU Fire Web Site (map.SDSU.edu & KPBS.org) • CERT Integration of Data & Procedures (# Fire, Amber Alert feeds, etc.) • Communications Robustness • Scalable Replica Web Servers • Mobile Cellular Transmitter • Resilient to Local Cellular Tower Loss • Capacity Prioritized for Emergency Responders
Calit2 Added Live Feeds From HPWREN Cameras to KPBS Google Map www.calit2.net/newsroom/release.php?id=1194
Recommendation Summary • System Architecture • Current state and predictive data integration • Where is fire now • Where is it going • When will it get there • Objectives • Situational Awareness • Communications Effectiveness • Early detection • Rapid Response • Benefits • Reduce insurance costs • Improve building codes • Save lives • Save property • Save the earth (prevent liberation of sequestered carbon • Policy Dependencies
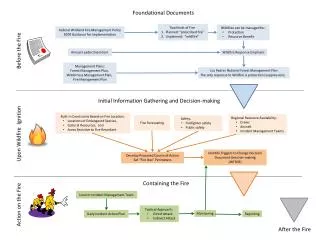
Upgraded Command Center Integrating Early Detection, Rapid Response, Situational Awareness www.nasa.gov/centers/dryden/news/Features/2007/wildfire_socal_10_07.html Flight Plan and Ikhana Data Displayed in San Diego Emergency Operations Center's Situation Room Pilot Flies Predator B from NASA Dryden in Edwards AF Base NASA Ames Overlaid Thermal-Infrared Images on Google Earth Maps, Transmitted in Near-Real Time to the Interagency Fire Center in Boise, Idaho NASA Ikhana Carrying Autonomous Modular Scanner on 8 Hour Flight, Coordinated with the FAA, Downlinks to NASA Ames
CTO Challenge Powerpoint To get these slides in Powerpoint formatgo to: HTTP://www.tapsns.com/media/fire2008/CTO-slides.ppt