Download
1 / 15
160 likes | 286 Views
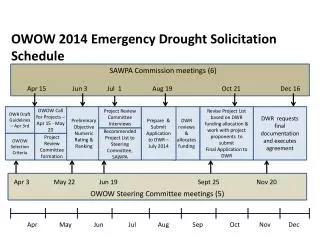
SAWPA OWOW 2.0 Project Ranking Process. December 6, 2012. Multi-Step Project Ranking Process. OWOW Steering Committee developed five criteria and weights and eight performance measures

E N D
SAWPA OWOW 2.0 Project Ranking Process December 6, 2012
Multi-Step Project Ranking Process • OWOW Steering Committee developed five criteria and weights and eight performance measures • Criteria equally weighted at 20% each (each criteria can contribute a maximum of 20% of the overall project score) • Project applicants submitted data to SAWPA • Project data initially reviewed for data entry errors by SAWPA • Scales developed and data normalized for each criteria • Data entered into Criterium Decision Plus (CDP) software and scored for each project • Results sorted into three tiers
Criterium Decision Plus Software • CDP software developed by InfoHarvest utilized to develop initial project tiers • CDP uses a multi-attribute rating technique • Methodology involves • Defining the evaluation criteria for comparison between alternatives • Developing performance measures indicating when a criterion is achieved • Determining the relative weight of importance that each criterion has in terms of influencing the decision
Criteria 1 – Improve Water Reliability and Reduce Reliance on Imported Water • AFY yields summed for each project: • Water use efficiency • Stormwater capture and storage • Recycled water reuse • Groundwater desalination • Other • Multiplied maximum AFY by 110% - maximum bookend • Example: Maximum summed AFY = 100 • Maximum scale = 110 (100 x 110%) • Minimum scale set to 0 • Projects with higher values receive higher scores for Criteria 1 • Resultant values entered into CDP
Criteria 2 – Improve Water Quality and Salt Balance in the Watershed • Three categories of data contribute to criteria score: • Non-point source reduction (mgd) • Reduction of TMDLs and other pollutants (kg/year) • Salt removal (tons/year) • Data normalized on scale of 1 to 5 for each category • 1 = worst • 5 = best • Data for each category with a value greater than 0 was divided into quartiles to facilitate developing ranges for the scale • Normalized data summed together by project across the three categories
Criteria 2 – Continued • Summed data adjusted by subtracting 2 to ensure projects with values of 1 in each category receive an overall value of 1, resultant values entered into CDP • Summed values greater than 5 capped at 5 • Example:
Criteria 3 – Manage Flood Waters Through Preservation and Restoration of Natural Hydrology • Three performance measures with varying weights: • 3a - Acres of habitat created (acres), weight 60% • 3b - Natural hydrology restoration and connectivity, weight 20% • 3c - LID or resource efficient land use practices, weight 20% • 3a assigned weight of 60% as provides greatest benefit to criteria • When a criteria has multiple performance measures resultant data for each performance measure is entered into CDP
Criteria 3 – Performance Measure 3a • Acres of habitat performance measure – developed using same methodology as Criteria 1 • Maximum bookend = 110% of maximum data value • Minimum bookend = 0
Criteria 3 – Performance Measures 3b and 3c • Data for performance measures 3b and 3c consists of yes/no answers to whether the project provides the applicable benefit and a description of the benefit • 1 = answer provided was no and no explanation • 2 = answer provided was yes and no explanation or explanation not applicable • 5 = answer provided was yes and logical explanation provided • Scale of 1 to 5 used • 1 = worst • 5 = best
Criteria 4 – Reduce Greenhouse Gas Emissions from Water Management Activities • Data normalized on scale of 1 to 5 for greenhouse emissions (co2e metric tons) • 1 = worst • 5 = best • Data > 10,000 co2e metric tons assigned a score of 5 • Data with a value greater than 0 and less than 10,000 co2e metric tons was divided into quartiles to facilitate developing ranges for the scale • Normalized data entered into CDP
Criteria 5 – Cost Effectiveness • Criteria is composed of five components evaluating the cost effectiveness on a per unit basis per year for each benefit claimed: • 5a - Cost per AFY of water • 5b - Cost per acre of habitat • 5c - Cost per tons of salt removed • 5d - Cost per mgd of water treated • 5e – Cost per kg of TMDL or other pollutants removed • Data normalized on scale of 1 to 5 for each component • 1 = worst • 5 = best • Data for each component with a value greater than 0 was divided into quartiles to facilitate developing ranges for the scale • Data for a component with a value of 0 received a score of 1
Criteria 5 – Continued • Normalized values for each component summed together and divided by 5 to arrive at cost effectiveness score • Data entered into CDP
Results • Tiers developed using natural breaks in resultant project scores from CDP • Tier 1 - Projects closely matching the OWOW project criteria • 100% match to 22% match of the OWOW project criteria • 33 projects • Tier 2 - Projects that match OWOW project criteria in some respects, but have deficiencies in areas • 21% match to a 5% match of the OWOW project criteria • 54 projects • Tier 3 – Projects that provide lesser benefits than projects in Tier 1 or Tier 2 or projects earlier in development phase or benefits cannot be determined at this time • 4% to 0% match of the OWOW project criteria • 49 projects
Results - Continued • Example on following slide illustrates overall contribution of each criteria for three hypothetical projects and provides a total score for each project based on output from CDP • Maximum score is 1 (100%) overall and 20% for each criteria