Download
1 / 71
710 likes | 820 Views
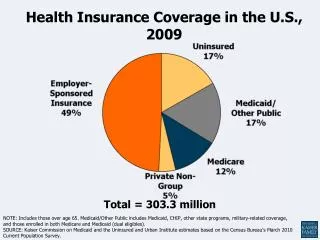
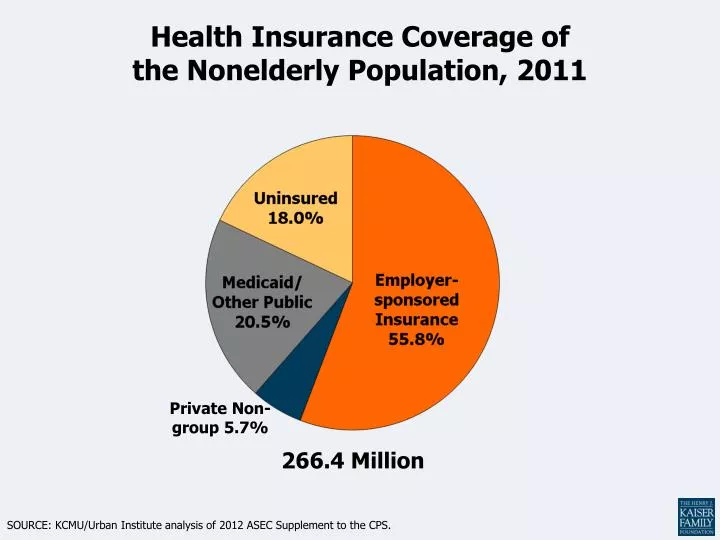
Health Insurance Coverage of the Nonelderly Population, 2011. Private Non-group 5.7%. 266.4 Million. SOURCE: KCMU/Urban Institute analysis of 2012 ASEC Supplement to the CPS. Number of Nonelderly Uninsured Americans, 2005 – 2011.

E N D
Health Insurance Coverage ofthe Nonelderly Population, 2011 Private Non-group 5.7% 266.4 Million SOURCE: KCMU/Urban Institute analysis of 2012 ASEC Supplement to the CPS.
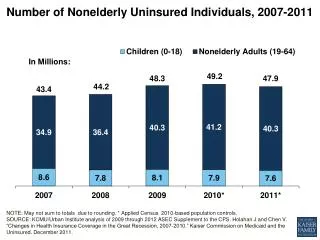
Number of Nonelderly Uninsured Americans, 2005 – 2011 SOURCE: DeNavas-Walt C, Proctor B, and Smith J. “Income, Poverty, and Health Insurance Coverage in the United States: 2011”. United States Census Bureau. Issued September 2012.
Uninsured Nonelderly vs. All Nonelderly,by Family Poverty Level, 2011 400% + 200% - 399% 100% - 199% Under 100% 47.9 Million 266.4 Million NOTES: Data may not total 100% due to rounding. The Federal Poverty Level for a family of four in 2011 was $22,350 (according to the HHS poverty guidelines). SOURCE: KCMU/Urban Institute analysis of 2012 ASEC Supplement to the CPS.
Nonelderly Health Insurance Coverage by Family Poverty Level, 2011 Number 400% + 90.5 M 72.1 M 200% - 399% 47.4 M 100% - 199% 56.3 M Under 100% NOTES: Data may not total 100% due to rounding. The Federal Poverty Level for a family of four in 2011 was $22,350 (according to the HHS poverty guidelines). SOURCE: KCMU/Urban Institute analysis of 2012 ASEC Supplement to the CPS.
Uninsured Nonelderly vs. All Nonelderly,by Family Work Status, 2011 No workers Only part-time One full-time worker Two full-time workers 47.9 Million 266.4 Million NOTES: Data may not total 100% due to rounding. SOURCE: KCMU/Urban Institute analysis of 2012 ASEC Supplement to the CPS.
Nonelderly’s Health Insurance Coverage by Family Work Status, 2011 Number 39.3 M 23.7 M 138.4 M 65.0 M No workers Only part-time One full-timeworker Two full-time workers NOTES: Data may not total 100% due to rounding. SOURCE: KCMU/Urban Institute analysis of 2012 ASEC Supplement to the CPS.
Uninsured Nonelderly vs. All Nonelderly,by Household Type, 2011 Adults, living together Adults, living alone Married, no children Other with children 1 parent with children 2 parents with children 47.9 Million 266.4 Million NOTES: Data may not total 100% due to rounding. Other households with children include families with at least three generations in a household, plus families in which adults are caring for children other than their own (e.g., a niece living with her aunt).SOURCE: KCMU/Urban Institute analysis of 2012 ASEC Supplement to the CPS.
Nonelderly Health Insurance Coverage by Household Type, 2011 Number 34.0 M Adults, living together 20.7 M Adults, living alone Married, no children 56.5 M Other with children 14.2 M 1 parent with children 35.7 M 2 parents with children 105.4 M NOTES: Other households with children include families with at least three generations in a household, plus families in which adults are caring for children other than their own (e.g., a niece living with her aunt). Data may not total 100% due to rounding. SOURCE: KCMU/Urban Institute analysis of 2012 ASEC Supplement to the CPS.
Uninsured Nonelderly vs. All Nonelderly,by Age Group, 2011 55 - 64 45 - 54 35 - 44 26 - 34 19 - 25 Under 19 47.9 Million 266.4 Million NOTES: Data may not total 100% due to rounding. SOURCE: KCMU/Urban Institute analysis of 2012 ASEC Supplement to the CPS.
Nonelderly Health Insurance Coverage by Age Group, 2011 Number 38.0M 55 - 64 43.9 M 45 - 54 39.7 M 35 - 44 36.8 M 26 - 34 19 - 25 29.7 M Under 19 78.4 M NOTES: Data may not total 100% due to rounding. SOURCE: KCMU/Urban Institute analysis of 2012 ASEC Supplement to the CPS.
Uninsured Nonelderly vs. All Nonelderly,by Health Status, 2011 Fair or Poor Good Excellent orvery good 266.4 Million 47.9 Million NOTES: Data may not total 100% due to rounding. SOURCE: KCMU/Urban Institute analysis of 2012 ASEC Supplement to the CPS.
Nonelderly Health Insurance Coverage by Health Status, 2011 Number Fair or poor 24.0 M Good 60.0 M Excellent orvery good 182.4 M NOTES: Data may not total 100% due to rounding. SOURCE: KCMU/Urban Institute analysis of 2012 ASEC Supplement to the CPS.
Uninsured Nonelderly vs. All Nonelderly,by Race and Ethnicity, 2011 Multiracial (2%) 2% American Indian (1%) Asian 1% Black Hispanic White 266.4 Million 47.9 Million NOTES: Data may not total 100% due to rounding. American Indian category includes Aleutian Eskimos. Asian includes South Pacific Islander. SOURCE: KCMU/Urban Institute analysis of 2012 ASEC Supplement to the CPS.
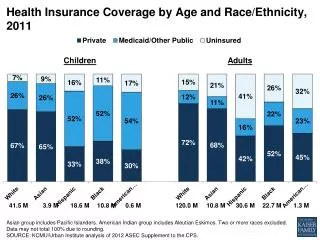
Nonelderly Health Insurance Coverage by Race and Ethnicity, 2011 Private Medicaid/Public Uninsured Number 5.6 M Multiracial 1.9 M American Indian 14.7 M Asian 33.5 M Black 49.2 M Hispanic White 161.6 M NOTES: Data may not total 100% due to rounding. American Indian category includes Aleutian Eskimos. Asian includes South Pacific Islander.SOURCE: KCMU/Urban Institute analysis of 2012 ASEC Supplement to the CPS.
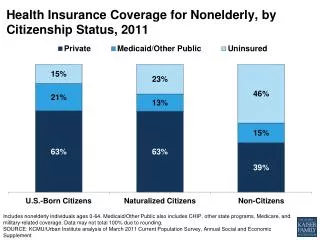
Uninsured Nonelderly vs. All Nonelderly,by Citizenship Status, 2011 Non-citizen0-4 years Non-citizen5 or more years U.S. citizen 266.4 Million 47.9 Million SOURCE: Kaiser Commission on Medicaid and the Uninsured/Urban Institute analysis of 2012 ASEC Supplement to the CPS.
Nonelderly Health Insurance Coverage by Citizenship Status, 2011 Number Non-citizen0-4 years 3.9 M Non-citizen5 years or more 16.8 M 245.7 M U.S. citizen NOTES: Data may not total 100% due to rounding. SOURCE: KCMU/Urban Institute analysis of 2012 ASEC Supplement to the CPS.
Uninsured Rates Among Nonelderly by State, 2010-2011 NH VT WA ME MT ND MN MA OR NY WI SD ID RI MI CT WY PA NJ IA NE OH NV IN IL DE UT WV VA MD CO CA KS MO KY DC NC TN OK SC AR AZ NM GA AL MS AK TX LA FL HI <14% Uninsured (13 states & DC) National Average = 18.2% 14 to 18% Uninsured (20 states) >18% Uninsured (17 states) SOURCE: KCMU/Urban Institute analysis of 2011 and 2012 ASEC Supplement to the CPS (two-year pooled data).
Health Insurance Coverage ofChildren, 2011 78.4 Million Children NOTES: Data may not total 100% due to rounding. Children includes all individuals under age 19. SOURCE: KCMU/Urban Institute analysis of 2012 ASEC Supplement to the CPS.
Uninsured Children vs. All Children,by Family Poverty Level, 2011 400% + 200-399% 100-199% Under 100% 7.6 Million 78.4 Million NOTES: The Federal Poverty Level for a family of four in 2011 was $22,350 (according to the HHS poverty threshold). Children includes all individuals under age 19. SOURCE: KCMU/Urban Institute analysis of 2012 ASEC Supplement to the CPS.
Children’s Health Insurance Coverage by Family Poverty Level, 2011 Number 400% + 20.7 M 200% - 399% 20.9 M 100% - 199% 15.8 M 21.0 M Under 100% NOTES: The Federal Poverty Level for a family of four in 2011 was $22,350 (according to the HHS poverty threshold). Children includes all individuals under age 19.SOURCE: KCMU/Urban Institute analysis of 2012 ASEC Supplement to the CPS.
Uninsured Children vs. All Children,by Family Work Status, 2011 No workers Only part-time One or two full-time workers 7.6 Million 78.4 Million NOTES: Data may not total 100% due to rounding. Children includes all individuals under age 19. SOURCE: KCMU/Urban Institute analysis of 2012 ASEC Supplement to the CPS.
Children’s Health Insurance Coverage by Family Work Status, 2011 Number No workers 10.7 M 6.2 M Only part-time One or two full-timeworkers 61.5 M NOTES: Children includes all individuals under age 19. SOURCE: KCMU/Urban Institute analysis of 2012 ASEC Supplement to the CPS.
Uninsured Children vs. All Children,by Household Type, 2011 Multigenerational/ Other 1 Parent 2 Parents 7.6 Million 78.4 Million NOTES: Children includes all individuals under age 19. Approximately 1% of children and 3% of uninsured children live in households with no adult. These are not shown in the above chart.SOURCE: KCMU/Urban Institute analysis of 2012 ASEC Supplement to the CPS.
Children’s Health Insurance Coverage by Household Type, 2011 Number Multigenerational/ Other 6.1 M 21.3 M 1 Parent 2 Parents 50.3 M NOTES: Data may not total 100% due to rounding. Children includes all individuals under age 19. Approximately 1% of children and 3% of uninsured children live in households with no adult. These are not shown in the above chart. SOURCE: KCMU/Urban Institute analysis of 2012 ASEC Supplement to the CPS.
Uninsured Children vs. All Children, by Age Group, 2011 18 13 - 17 6 - 12 1 - 5 <1 7.6 Million 78.4 Million NOTES: Data may not total 100% due to rounding. Children includes all individuals under age 19. SOURCE: KCMU/Urban Institute analysis of 2012 ASEC Supplement to the CPS.
Children’s Health Insurance Coverage by Age Group, 2011 Number 18 4.3 M 13 - 17 21.2 M 6 - 12 28.6 M 1 - 5 20.4 M <1 3.9 M NOTES: Data may not total 100% due to rounding. Children includes all individuals under age 19. SOURCE: KCMU/Urban Institute analysis of 2012 ASEC Supplement to the CPS.
Uninsured Children vs. All Children,by Health Status, 2011 Fair or Poor (2%) 2% Good Excellent orvery good 78.4 Million 7.6 Million NOTES: Children includes all individuals under age 19. SOURCE: KCMU/Urban Institute analysis of 2012 ASEC Supplement to the CPS.
Children’s Health Insurance Coverage by Health Status, 2011 Number Fair or poor 1.7 M 12.3 M Good Excellent orvery good 64.4 M NOTES: Data may not total 100% due to rounding. Children includes all individuals under age 19. SOURCE: KCMU/Urban Institute analysis of 2012 ASEC Supplement to the CPS.
Uninsured Children vs. All Children,by Race and Ethnicity, 2011 Multiracial (3%) 4% Am. Indian (1%) Asian 1% Black Hispanic White 7.6 Million 78.4 Million NOTES: Children includes all individuals under age 19. American Indian category includes Aleutian Eskimos. Asian includes South Pacific Islander. Data may not total 100% due to rounding.SOURCE: KCMU/Urban Institute analysis of 2012 ASEC Supplement to the CPS.
Children’s Health Insurance Coverage by Race and Ethnicity, 2011 Private Medicaid/Public Uninsured Number 3.0 M Multiracial 0.6 M Am. Indian 3.9 M Asian 10.8 M Black Hispanic 18.6 M 41.5 M White NOTES: Children includes all individuals under age 19. American Indian category includes Aleutian Eskimos. Asian includes South Pacific Islander. Data may not total 100% due to rounding.SOURCE: KCMU/Urban Institute analysis of 2012 ASEC Supplement to the CPS.
Uninsured Children vs. All Children,by Citizenship Status, 2011 1% Non-citizen0-4 years Non-citizen5 or more years U.S. citizen 7.6 Million 78.4 Million NOTES: Children includes all individuals under age 19. Data may not total 100% due to rounding. SOURCE: KCMU/Urban Institute analysis of 2012 ASEC Supplement to the CPS.
Children’s Health Insurance Coverage by Citizenship Status, 2011 Number Non-citizen0-4 years 0.8 M Non-citizen5 or more years 1.4 M U.S. citizen 76.2 M NOTES: Children includes all individuals under age 19. Data may not total 100% due to rounding. SOURCE: KCMU/Urban Institute analysis of 2012 ASEC Supplement to the CPS.
Uninsured Rates for Children by State, 2010-2011 NH VT WA ME MT ND MN MA OR NY SD WI ID RI MI CT WY PA NJ IA NE OH IN DE NV IL WV UT MD VA CO KY CA KS MO NC DC TN OK SC AR AZ NM GA MS AL TX LA AK FL HI < 9% (27 states and DC) 9-12% (16 states) US Average = 9.9% > 12% (7 states) NOTES: Children includes all individuals under age 19. SOURCE: KCMU/Urban Institute analysis of 2011 and 2012 ASEC Supplement to the CPS (two-year pooled data).
Health Insurance Coverage ofNonelderly Adults, 2011 188.0 Million Nonelderly Adults NOTES: Adults includes all individuals aged 19 to 64. Data may not total 100% due to rounding.SOURCE: KCMU/Urban Institute analysis of 2012 ASEC Supplement to the CPS.
Uninsured Adults vs. All Adults,by Family Poverty Level, 2011 400% + 200-399% 100-199% Under 100% 40.3 Million 188.0 Million NOTES: The Federal Poverty Level for a family of four in 2011 was $22,350. Adults includes all individuals aged 19-64. Data may not total 100% due to rounding. SOURCE: KCMU/Urban Institute analysis of 2012 ASEC Supplement to the CPS.
Adults’ Health Insurance Coverage by Family Poverty Level, 2011 Number 400% + 69.8 M 51.2 M 200-399% 100-199% 31.6 M Under 100% 35.4 M NOTES: The Federal Poverty Level for a family of four in 2011 was $22,350. Adults includes all individuals aged 19-64. Data may not total 100% due to rounding. SOURCE: KCMU/Urban Institute analysis of 2012 ASEC Supplement to the CPS.
Uninsured Adults vs. All Adults,by Family Work Status, 2011 Non-workers Only part-time One full-time worker Two full-time workers 188.0 Million 40.3 Million NOTES: Adults includes all individuals aged 19 to 64. Data may not total 100% due to rounding.SOURCE: KCMU/Urban Institute analysis of 2012 ASEC Supplement to the CPS.
Adults' Health Insurance Coverage by Family Work Status, 2011 Number 28.6 M No workers 17.5 M Only part-time One full-timeworker 97.0 M Two full-time workers 44.9 M NOTES: Adults includes all individuals aged 19 to 64. Data may not total 100% due to rounding.SOURCE: KCMU/Urban Institute analysis of 2012 ASEC Supplement to the CPS.
Uninsured Adults vs. All Adults,by Education, 2011 College graduate Some college High school graduate Less thanhigh school 40.3 Million 188.0 Million NOTES: “Some college” category includes respondents with an associate’s degree. Adults includes all individuals aged 19 to 64. Data may not total 100% due to rounding. SOURCE: KCMU/Urban Institute analysis of 2012 ASEC Supplement to the CPS.
Adults' Health Insurance Coverage by Education, 2011 Number College graduate 55.8 M Some college 57.2 M High school graduate 54.7 M Less thanhigh school 20.4 M NOTES: “Some college” category includes respondents with an associate’s degree. Adults includes all individuals aged 19 to 64. Data may not total 100% due to rounding. SOURCE: KCMU/Urban Institute analysis of 2012 ASEC Supplement to the CPS.
Uninsured Adults vs. All Adults,by Household Type, 2011 Adults, living together Adults, living alone Married, no children Other with children 1 parent with children 2 parents with children 40.3 Million 188.0 Million NOTES: Other households with children include families with at least three generations in a household, plus families in which adults are caring for children other than their own (e.g., a niece living with her aunt). Adults includes all individuals aged 19 to 64. Data may not total 100% due to rounding.SOURCE: KCMU/Urban Institute analysis of 2012 ASEC Supplement to the CPS.
Adults' Health Insurance Coverage by Household Type, 2011 Number 33.4 M Adults, living together 20.7 M Adults, living alone 56.4 M Married, no children 8.1 M Other with children 14.3 M 1 parent with children 2 parents with children 55.1 M NOTES: Other households with children include families with at least three generations in a household, plus families in which adults are caring for children other than their own (e.g., a niece living with her aunt). Adults includes all individuals aged 19 to 64. Data may not total 100% due to rounding.SOURCE: KCMU/Urban Institute analysis of 2012 ASEC Supplement to the CPS.
Uninsured Adults vs. All Adults,by Age Group, 2011 55 - 64 40 - 54 30 - 39 26 - 29 19 - 25 40.3 Million 188.0 Million NOTES: Adults includes all individuals aged 19 to 64. Data may not total 100% due to rounding. SOURCE: KCMU/Urban Institute analysis of 2012 ASEC Supplement to the CPS.
Adults' Health Insurance Coverage by Age Group, 2011 Number 55 - 64 38.0 M 40 - 54 64.5 M 30 - 39 39.2 M 16.7 M 26 - 29 29.7 M 19 - 25 NOTES: Adults includes all individuals aged 19 to 64. Data may not total 100% due to rounding. SOURCE: KCMU/Urban Institute analysis of 2012 ASEC Supplement to the CPS.
Uninsured Adults vs. All Adults,by Health Status, 2011 Fair or Poor Good Excellent orvery good 40.3 Million 188.0 Million NOTES: Adults includes all individuals aged 19 to 64. Data may not total 100% due to rounding. SOURCE: KCMU/Urban Institute analysis of 2012 ASEC Supplement to the CPS.
Adults' Health Insurance Coverage by Health Status, 2011 Number Fair or poor 22.3 M 47.7 M Good Excellent orvery good 118.0 M NOTES: Adults includes all individuals aged 19 to 64. Data may not total 100% due to rounding. SOURCE: KCMU/Urban Institute analysis of 2012 ASEC Supplement to the CPS.
Uninsured Adults vs. All Adults,by Race and Ethnicity, 2011 Multiracial (2%) 1% Am. Indian (1%) Asian 1% Black Hispanic White 40.3 Million 188.0 Million NOTES: American Indian category includes Aleutian Eskimos. Adults includes all individuals aged 19 to 64. Data may not total 100% due to rounding. SOURCE: KCMU/Urban Institute analysis of 2012 ASEC Supplement to the CPS.
Adults' Health Insurance Coverage by Race and Ethnicity, 2011 Number 2.6 M Multiracial 1.3 M Am. Indian Asian 10.8 M Black 22.7 M 30.6 M Hispanic 120.0 M White NOTES: American Indian category includes Aleutian Eskimos. Adults includes all individuals aged 19 to 64. Asian includes South Pacific Islander. Data may not total 100% due to rounding.SOURCE: KCMU/Urban Institute analysis of 2012 ASEC Supplement to the CPS.
Uninsured Adults vs. All Adults,by Citizenship Status, 2011 Non-citizenless than 5 years Non-citizen5 or more years U.S. citizen 40.3 Million 188.0 Million NOTES: Adults includes all individuals aged 19 to 64. Data may not total 100% due to rounding.SOURCE: KCMU/Urban Institute analysis of 2012 ASEC Supplement to the CPS.
Adults' Health Insurance Coverage by Citizenship Status, 2011 Number Non-citizen0-4 years 3.0 M Non-citizen5+ years 15.4 M U.S. citizen 169.5 M NOTES: Adults includes all individuals aged 19 to 64. Data may not total 100% due to rounding.SOURCE: KCMU/Urban Institute analysis of 2012 ASEC Supplement to the CPS.