Download
1 / 31
340 likes | 708 Views
Exploratory Factor Analysis --- Dataset (TOSSE-R.sav). Presenter : Melody Date: June 1, 2013. Suitable for FA? Based on what? Stages of making a decision on the factors to be extracted What is the convergent validity? discriminant validity?

E N D
Exploratory Factor Analysis --- Dataset (TOSSE-R.sav) Presenter : Melody Date: June 1, 2013
Suitable for FA? Based on what? • Stages of making a decision on the factors to be extracted • What is the convergent validity? discriminant validity? • Reliability. Overall reliability? Extracted factors’ reliability? • Interpretation of the factor structure label these extracted factors • Conclusion
Suitable for FA? • At the initial stage of preliminary checking: • Correlation R-Matrix These items are eyesores. Q6 (r = .271), Q7(r = .225), Q10 (r =.254), Q12 (r =.079), Q19 (r = - .095), Q20 (r = .171), Q23 (r = .281), Q25 (r =.176), Q26 (r = .151), and Q27 (r = .259) Why? The standard that the extent of association among items should be within 0.3~0.8 is not met.
Suitable for FA? • Communalities table singularity Q12 (factor loading value is 0.297) • Determinant value : 0.00000124 < 0.00001 multicollinearity problem
Suitable for FA? • At the initial stage of preliminary checking: • KMO value (= .894) > 0.5 • Barlett’s test of sphericity: statistical sig. • Anti-image Correlation Matrix shows that values along diagonal line is larger than 0.5, and values off the diagonal line are dominantly smaller, which meet the Measure of sampling adequacy (MSA) criteria with 0.5 set as the minimum requirement.
Suitable for FA? • Bland’s theory of research methods lecturers predicted that good research methods lecturers should have four characteristics (i.e., a profound love of statistics, an enthusiasm for experimental design, a love of teaching, and a complete absence of normal interpersonal skills). supported or refuted? • These four characteristics are correlated to some degree. Multicollinearity is understandable .
Suitable for FA? • In terms of • KMO with statistical significance, an indicator of sampling adequacy, • Anti-image Correlation Matrix, meeting the Measure of sampling adequacy (MSA) • Communalities: most items have reached the minimum criterion 0.5, indicating that most items have reached the degree of being explained by common factors Suitable for FA, but some items had better be crossed out.
Stages of making a decision on the factors to be extracted • At the preliminary stage : an action taken: Q12 (singularity problem) and Q10 (comparatively low factor loading value =0.417< 0.5) deleted. • At the second stage: an action taken : the remaining items (26 items) are under EFA by resorting to abliminrotation approach. ( because of expected correlated underlying factors)
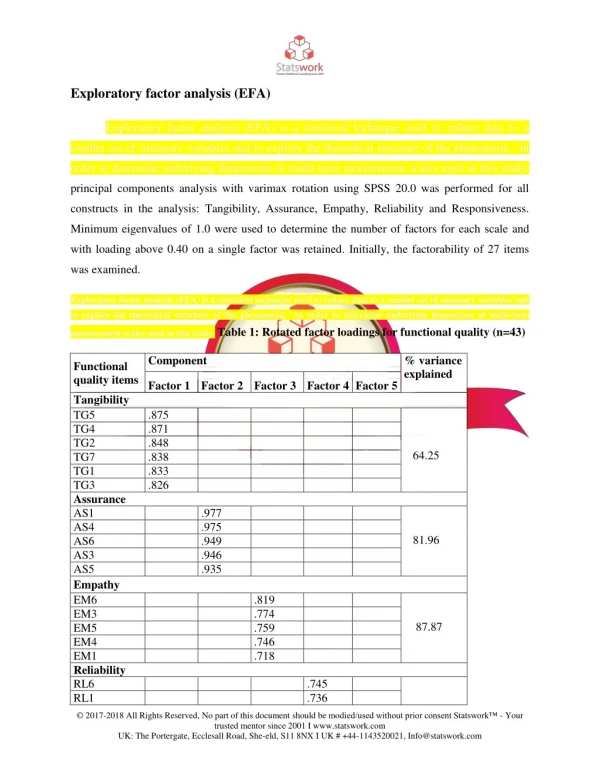
Stages of making a decision on the factors to be extracted • At the second stage: • Pattern Matrix table Q21 and Q27 crossing-load on two components the loading values of Q1, Q9, and Q11 are suppressed due to their coefficient values below the threshold set as 0.4.
Stages of making a decision on the factors to be extracted • At the second stage: Q21, Q27, Q1, Q9, and Q11 deleted. 21 items are left for EFA again. • At the third stage: • determinant value (=0.000),slightly larger than the benchmark 0.00001. • Pattern Matrix : no crossing-loading variables.
Stages of making a decision on the factors to be extracted • At the third stage: • KMO value is .868 with statistical significance • total variance of being explained : these extracted five components after rotation account for nearly 62 percent of variance • eigenvalue of each component >1 • communalities: only one variable value, Q7 (= 0.478), is below the threshold value 0.5.
Stages of making a decision on the factors to be extracted • Pattern Matrix : two items ---Q7 (.483), Q26(.438) --- factor loadings are not as high as other items loaded onto factors. • But in terms of convergent validity criteria flexibly varying with various sample sizes, these variables Q7,Q26 still with sufficient factor loading values (minimum benchmark 0.35~0.4 for sample size ranging from 250~200), if retained, can be justified.
Stages of making a decision on the factors to be extracted • Kaiser’s criterion is not met communalities values after extraction > 0.7 ( if the # of variables is less than 30 ) sample size > 250 average communality > 0.6 retain all factors with eigenvalues above 1 • Scree plot is the last resort to turn to if sample size is large (i.e., around 300 or more) • 21 items decided five factors extracted
Convergent Validity • refer to to what extent variables loaded within a factor are correlated the higher loading, the better. • Factor structure : • check Pattern Matrix to know about the convergent validity (no crossing-loadings between factors ) variables precisely loading on factors • check convergent validity in terms of sample size. In this case, the sample size is 239; the convergent validity is acceptable, for most variables are above the range of 0.35 to 0.4. in terms of loadings within factors.
Discriminant Validity • 2 ways to check discriminant validity • Check Pattern Matrix to see no crossing-loadings • Check Factor Correlation Matrix : correlations between factors do not exceed 0.7.
Discriminant Validity Correlations between factors do not exceed 0.7
Overall Reliability of the 21 items in the dataset (TOSSE.sav.) Larger than 0.7
Reliability of Comp 1> 0.7 Reliability of Comp 2 =. 0.7
Reliability of Comp 3 > 0.7 Reliability of Comp 4 =. 0.7 Reliability of Comp 5 > 0.7
Interpretation of extracted 5 factors • labels of the five factors: • Component 1: ‘Passion for Applying Statistics Knowledge’ • Component 2 : ‘Apprehension for Teaching ’ • Component 3: ‘Obsession with Successfully Applying Statistics to Experiment’ • Component 4: ‘Preference for being alone’, • Component 5: ‘Passion for teaching Statistics’
Component 3: ‘Obsession with Successfully Applying Statistics to Experiment’
Conclusion • The extracted five factors refute Bland’s theory through the EFA, for • we are asked to test the theory of four personality traits • the labeling of Component 2 (Apprehension for Teaching) contradicts the labeling of Component 5 (Passion for teaching Statistics) • Individual Factor reliability ---Comp 2 / Comp 4 at the margin of 0.7, not above 0.7
Why don’t we first group the question items into four components in correspondence with the four characteristics proposed by Bland, and then run FA? CFA?
Conclusion • When EFA is resorted to, very often an extracted factor loaded with some variables as a cluster is hard to be labeled. And thus several trials seem unavoidable until the labeling of a factor can comprehensively interpret the variables loaded on that factor. • As such, this dataset seems to be more like a CFA case because of the already-existing hypothesis about the underlying constructs (i.e., four personality traits).