Download
1 / 8
80 likes | 186 Views
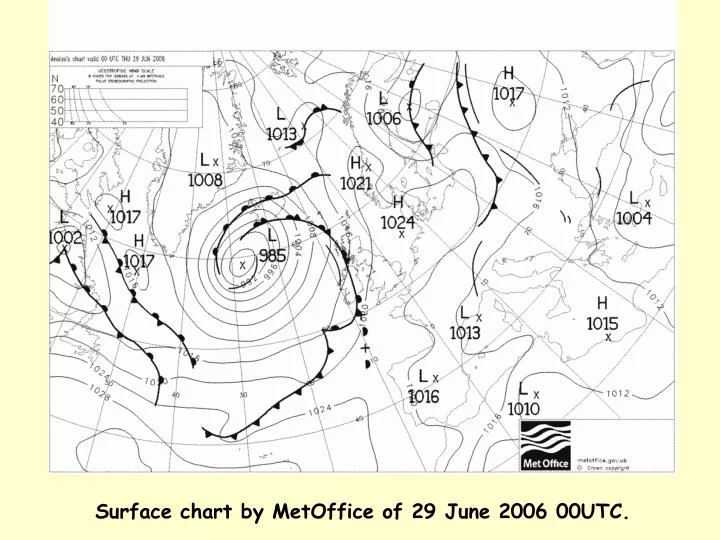
Surface chart by MetOffice of 29 June 2006 00 UTC. Synoptic situation -- based on Ákos Horváth ’s paper West from Hungary there was a weak stationary cold front for several days.

E N D
Synoptic situation -- based on Ákos Horváth’s paper West from Hungary there was a weak stationary cold front for several days. During the days before the 29th of June 2006, several huge storms, convective systems developed along this stationary cold front. Leaving the front afterward they moved deep into the warm sector where they often strengthened due to high instability (if enough moisture was present). On the 29th two MCSs crossed the country on the same day, which is quite rare in Hungary.
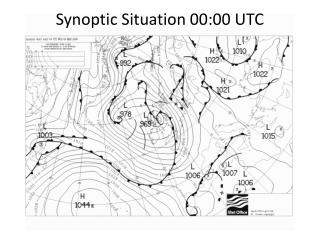
Rather weak pressure gradient at the surface Inactive cold front (Boroclinic boundary) ECMWF analysis at 29.06.2006. 00UTC: sea-level pressure (with step 2.5 hPa), temperature at 850 hPa (colors)and wind field at 925 hPa.
Cold advection at 500hPa Increasing wind speed (increases instability) The geopotential height gradient is not large 500 hPa chart based on ECMWF analysis at 29.06.2006. 00UTC:geopotential height (with 40m steps), temperature (colors)and wind
No significant strong wind or jet over the Carpathian Basin, but divergent flow field WV6.2 image at 29.06.2006. 00UTC overlaid by the 300 hPa wind of ECMWF analysis
Satrep analysis of synoptic situation on 29 June 2006 12UTC.
Concerning the first MCS: The convective cells initially developed along the stationary (a thermally developed, but dynamically inactive) cold front, and left the front afterward moving deep into the warm sector. The motion of the convective system in the warm sector was not much influenced by the synoptic scale processes. It was mainlydetermined by the local environment (high instability in the thickness ridge). The numerical models did not forecast the first MCS. Concerning the second MCS: The second MCS formed by joining of a system developed along the inactive cold front during the previous night, and the cells developed over the Dinaric Mountains in the afternoon. The second MCS was better forecasted by the numerical models. Its evolution and movement seems to be more influenced by the synoptic scale processes.