Download
1 / 1
20 likes | 117 Views
AVERAGE HOURS OF ELECTRICITY AVAILABLE TO GOVERNORATE PER DAY OVER A 7 DAY PERIOD ≤ 8 Hrs = Red 9 to 15 Hrs =Amber ≥ 16 Hrs = Green No Report = White. Dahok 90 MW 15 Hrs. Arbil 18 Hrs. Naynawa 302 MW 9 Hrs. Sulaymaniyah 123 MW 19 Hrs. Tamim 120 MW 12 Hrs. Salah Ad Din 191 MW

E N D
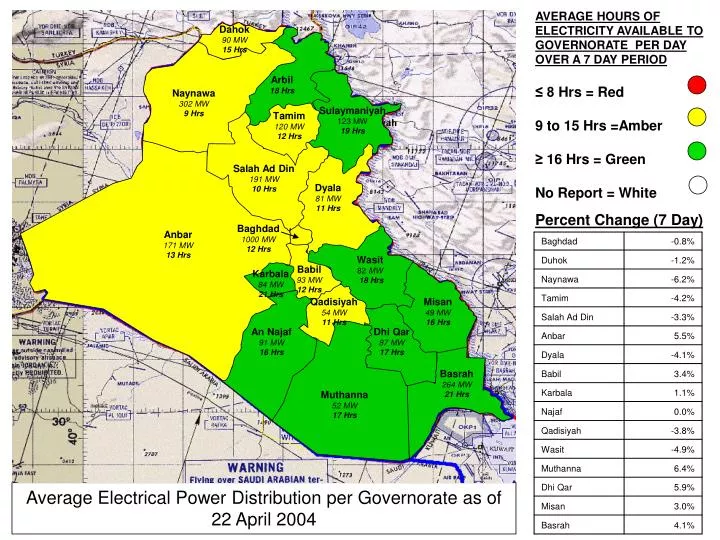
AVERAGE HOURS OF ELECTRICITY AVAILABLE TO GOVERNORATE PER DAY OVER A 7 DAY PERIOD ≤ 8 Hrs = Red 9 to 15 Hrs =Amber ≥ 16 Hrs = Green No Report = White Dahok 90 MW 15 Hrs Arbil 18 Hrs Naynawa 302 MW 9 Hrs Sulaymaniyah 123 MW 19 Hrs Tamim 120 MW 12 Hrs Salah Ad Din 191 MW 10 Hrs Dyala 81 MW 11 Hrs Percent Change (7 Day) Baghdad 1000 MW 12 Hrs Anbar 171 MW 13 Hrs Baghdad -0.8% Wasit 82 MW 18 Hrs Duhok -1.2% Babil 93 MW 12 Hrs Karbala 84 MW 21 Hrs Naynawa -6.2% Tamim -4.2% Qadisiyah 54 MW 11 Hrs Misan 49 MW 16 Hrs Salah Ad Din -3.3% An Najaf 91 MW 16 Hrs Dhi Qar 87 MW 17 Hrs Anbar 5.5% Dyala -4.1% Babil 3.4% Basrah 264 MW 21 Hrs Karbala 1.1% Muthanna 52 MW 17 Hrs Muthanna 10 Hrs 38 MW Najaf 0.0% Qadisiyah -3.8% Wasit -4.9% Muthanna 6.4% Dhi Qar 5.9% Average Electrical Power Distribution per Governorate as of 22 April 2004 Misan 3.0% Basrah 4.1%