Download
1 / 1
20 likes | 102 Views
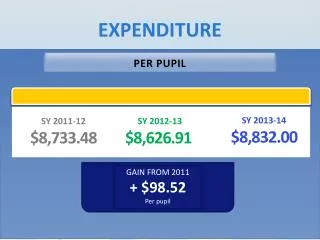
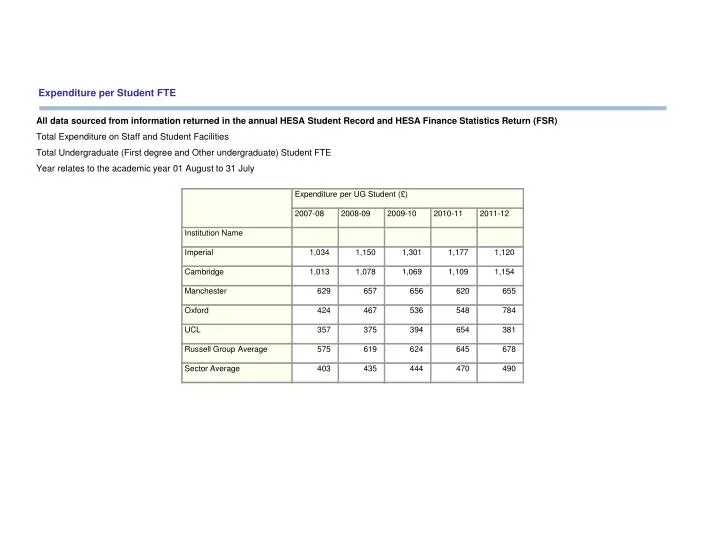
Expenditure per Student FTE. All data sourced from information returned in the annual HESA Student Record and HESA Finance Statistics Return (FSR). Total Expenditure on Staff and Student Facilities. Total Undergraduate (First degree and Other undergraduate) Student FTE.

E N D
Expenditure per Student FTE All data sourced from information returned in the annual HESA Student Record and HESA Finance Statistics Return (FSR) Total Expenditure on Staff and Student Facilities Total Undergraduate (First degree and Other undergraduate) Student FTE Year relates to the academic year 01 August to 31 July Expenditure per UG Student (£) 2007-08 2008-09 2009-10 2010-11 2011-12 Institution Name Imperial 1,034 1,150 1,301 1,177 1,120 Cambridge 1,013 1,078 1,069 1,109 1,154 Manchester 629 657 656 620 655 Oxford 424 467 536 548 784 UCL 357 375 394 654 381 Russell Group Average 575 619 624 645 678 Sector Average 403 435 444 470 490