Download
1 / 21
210 likes | 325 Views
Evaluation of CMAQ using Satellite Remote Sensing Measurements. Krish Vijayaraghavan 1 , Jianlin Hu 2 , Yang Zhang 2 , Xiong Liu 3 , Kelly Chance 3 , and Hilary E. Snell 1 1 Atmospheric & Environmental Research, Inc. (AER) 2 North Carolina State University

E N D
Evaluation of CMAQ using Satellite Remote Sensing Measurements Krish Vijayaraghavan 1, Jianlin Hu 2, Yang Zhang 2, Xiong Liu 3, Kelly Chance 3, and Hilary E. Snell 1 1 Atmospheric & Environmental Research, Inc. (AER) 2 North Carolina State University 3 Harvard-Smithsonian Center for Astrophysics CMAS Conference, Oct 16-18, 2006 Chapel Hill, NC
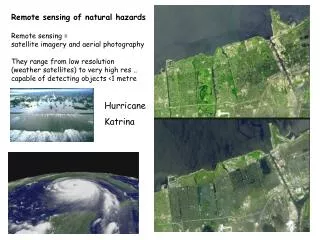
Study Overview • Advantages of satellite retrievals vs. in-situ measurements • More complete spatial coverage • Vertically-integrated measure of air quality • Measure of long-range transport • Our earlier studies have compared satellite retrievals with CMAQ calculations of tropospheric columns of NO2/CO/HCHO, O3 residuals, and aerosol optical depth (Vijayaraghavan et al., 2006; Zhang et al., 2005, 2006) • Here we compare CMAQ results with satellite retrievals of tropospheric column ozone and carbon monoxide vertical profiles
CMAQ Application • CMAQ version 4.4 • Simulation period: 2001 • Modeling domain: N. America • Grid resolution: 36 km x 36 km, 14 layers (up to ~15 km) • Meteorology, Emissions, ICs/BCs from U.S. EPA • Meteorology MM5-driven • Emissions 1999 NEI; MOBILE6/BEIS 3.12/SMOKE1.4 • ICs/BCs from global model (GEOS-Chem) 10 day CMAQ spinup
Satellite Retrievals of Carbon monoxide from MOPITT on Terra Satellite MOPITT – “Measurements of Pollution in the Troposphere” (Emmons et al, 2004) Instrument measures infrared radiation directed upwards from the Earth’s surface CO mixing ratio profiles and total column amounts are retrieved from the radiances Horizontal resolution of 1x1o (Level-3) Vertical resolution of 3-4 km CO profiles at seven vertical pressure levels: 1000 hPa, 850 hPa, 700 hPa, 500 hPa, 350 hPa, 250 hPa, and 150 hPa (Figure from http://www.space.gc.ca)
Averaging Kernels • The averaging kernel represents the way in which the vertical • structure of the atmosphere is mapped into the measured radiances • x' = A xtrue + (I – A) xa (Deeter et al., 2002) • x' = CO retrieved profile from MOPITT • A = Averaging Kernel matrix • xtrue = “True” CO profile • I = Identity matrix • xa = “a priori” CO profile • MOPITT “a priori” CO profile obtained from global aircraft datasets (up to • 400 mb) and “MOZART” simulated values of CO (at higher altitudes) • Averaging Kernel A = I – CxCa-1 • Cx = Retrieved errorcovariance matrix; Ca = a priori covariance matrix
CMAQ Retrievals ofVertical Profiles of Carbon monoxide • MOPITT has a finite vertical resolution • CO retrieval assigned to a given vertical level includes information from a range of altitudes above and below the reported level • Valid comparisons of model with retrievals must include a transformation of the model output into a vertically averaged quantity at each level • Steps for converting CMAQ output before comparison to MOPITT • Resampling: Interpolate CMAQ output to MOPITT pressure grid • Kernel Calculation: Calculate averaging kernel using Cx and Ca • Transformation: Calculate a pseudo-retrieval x 'CMAQ using the a priori , interpolated CMAQ values, and the averaging kernel
Annual Average CO Mixing Ratiosat Two Vertical Pressure Levels CMAQ MOPITT at 1000 hPa at 250 hPa CO mixing ratios from CMAQ and MOPITT are both shown after applying averaging kernels
Annual Average CO Vertical Profiles Chicago, IL Los Angeles, CA Houston, TX
Seasonal Average CO Vertical Profilesat Los Angeles, CA Winter (Jan, Dec) Fall (Sep, Oct, Nov) Summer (Jun, Jul, Aug) Spring (Mar, Apr, May)
Statistical Performance of Annual Average CO Profiles from CMAQ NMB – Normalized mean bias; NME – Normalized mean error
Satellite Retrievals ofTropospheric Column Ozone (TCO) Residual Method for calculating TCO • O3 residual (TCO) = Total column O3 – Stratospheric column O3 (SCO) • Disadvantage: • Often assumes the distribution and variability of SCO Direct retrieval of TCO • The first directly retrieved global distribution of TCO from Global Ozone Monitoring Experiment (GOME) measurements was presented by Liu et al. (2005, 2006)
Global Ozone Monitoring Experiment (GOME)on the ERS-2 Satellite (Figure from http://earth.esa.int) • GOME measures backscattered radiance spectra from the Earth’s • atmosphere in 240-790 nm range • High signal to noise ratio in the UV ozone absorption bands => Can retrieve the • tropospheric O3 vertical distribution (Chance et al., 1991, 1997; Liu et al., 2006) • In this study, 2001 profiles of partial column O3 are retrieved at 24 layers with • the tropopause as one of the levels • Horizontal resolution = 960 km x 80 km
Tropospheric Column Ozone (TCO)from CMAQ f (O3,i, Ti, Pi, Dzi) • CMAQ TCO calculated up to layer N • N corresponds to the tropopause in the GOME retrievals • N = f (Location, Time) • TCO in Dobson units (DU) • Lat/Lon of GOME retrieval mapped to the CMAQ 36 km grid • GOME TCO = sum of tropospheric partial columns up to the • tropopause • CMAQ TCO compared with GOME TCO
Statistical Performance of CMAQ TCO * NMB – Normalized mean bias; NME – Normalized mean error
Possible Reasons for Discrepanciesbetween CMAQ and GOME TCO • Uncertainty in CMAQ ozone boundary conditions • CMAQ TCO calculated to the layer nearest the tropopause • and not to the exact tropopause pressure • Uncertainty in GOME retrievals and limited vertical • resolutions • GOME Averaging kernels (AK) were not applied to CMAQ • TCO. Applying AK to CMAQ results after augmenting with • other high-resolution data above the tropopause should • improve model performance
Conclusions • Satellite measurements offer some advantages over in-situ measurements • for evaluating the performance of chemistry transport models such as CMAQ. • CO vertical profiles and tropospheric column ozone (TCO) simulated by • CMAQ at a 36 km horizontal resolution over the U.S. in 2001 were • evaluated using MOPITT CO and GOME TCO satellite retrievals. • CO vertical profiles and spatial distributions from CMAQ after applying • averaging kernels are typically comparable to those from MOPITT • (over all layers: error = 5%, bias = -3%, r = 0.96). • TCO from CMAQ exhibits a low positive bias and moderate error with respect • to GOME, but correlation is low (annual avg. error= 25%, bias= 7%, r= 0.26). • Possible reasons for discrepancies between CMAQ and satellite retrievals • include uncertainties in CMAQ inputs and species retrieval, limitations in • satellite retrievals, and not applying averaging kernels to CMAQ TCO.
Acknowledgements • Study funded by NASA Award No. NNG04GJ90G • Research at the Smithsonian Astrophysical Observatory • was supported by NASA and the Smithsonian Institution • Input files from U.S. EPA • (Kenneth Schere, Warren Peters, George Pouliot)
Evaluation of CMAQ using Satellite Remote Sensing Measurements Krish Vijayaraghavan 1, Jianlin Hu 2, Yang Zhang 2, Xiong Liu 3, Kelly Chance 3, and Hilary E. Snell 1 1 Atmospheric & Environmental Research, Inc. (AER) 2 North Carolina State University 3 Harvard-Smithsonian Center for Astrophysics CMAS Conference, Oct 16-18, 2006 Chapel Hill, NC
References Chance, K.V., J.P. Burrows, and W. Schneider, 1991: Retrieval and molecule sensitivity studies for the Global Ozone Monitoring Experiment and the SCanning Imaging Absorption spectroMeter for Atmospheric CHartographY, Proc. S.P.I.E., Remote Sensing of Atmospheric Chemistry 1491, 151-165. Chance, K.V., J.P. Burrows, D. Perner, and W. Schneider, 1997: Satellite measurements of atmospheric ozone profiles, including tropospheric ozone, from ultraviolet/visible measurements in the nadir geometry: a potential method to retrieve tropospheric ozone, J. Quant. Spectrosc. Radiat. Transfer, 57, 467-476. Deeter, M.N., Calculation and Application of MOPITT Averaging Kernels, July 2002, from http://www.eos.ucar.edu/mopitt/data, website accessed October 2006. Emmons, L. K., M. N. Deeter, J. C. Gille, D. P. Edwards, J.-L. Attié, J. Warner, D. Ziskin, G. Francis, B. Khattatov, V. Yudin, J.-F. Lamarque, S.-P. Ho, D. Mao, J. S. Chen, J. Drummond, P. Novelli, G. Sachse, M. T. Coffey, J. W. Hannigan, C. Gerbig, S. Kawakami, Y. Kondo, N. Takegawa, H. Schlager, J. Baehr, H. Ziereis, 2004: Validation of Measurements of Pollution in the Troposphere (MOPITT) CO retrievals with aircraft in situ profiles, J. Geophys. Res., 109, D03309, doi:10.1029/2003JD004101. Liu, X., K. Chance, C.E. Sioris, R.J.D. Spurr, T.P. Kurosu, R.V. Martin and M.J. Newchurch, 2005b: Ozone profile and tropospheric ozone retrievals from the Global Ozone Monitoring Experiment: Algorithm description and validation, J. Geophys. Res., 110, doi:10.1029/2005JD006240. Liu X., K. Chance, C.E. Sioris, T.P. Kurosu, R.J.D. Spurr, R.V. Martin, M. Fu, J.A. Logan, D.J. Jacob, P.I. Palmer, M.J. Newchurch, I. Megretskaia, R. Chatfield, 2006a: First directly retrieved global distribution of tropospheric column ozone: comparison with the GOES-CHEM model, J. Geophys. Res., 111(D2), D02308, 10.1029/2005JD006564. Vijayaraghavan, K., Y. Zhang, H.E. Snell and J-P. Huang, 2006. Evaluation of a Regional Air Pollution Model with Satellite Measurements, NCAR Community Workshop on Air Quality Remote Sensing from Space: Defining an Optimum Observing Strategy, February 21-23, 2006, Boulder, Colorado. Zhang, Y., H.E. Snell, K. Vijayaraghavan and M.Z. Jacobson, Evaluation of Regional PM Predictions with Satellite and Surface Measurements, AAAR 2005 Annual Conference, October 17-21, 2005, Austin, Texas. Zhang, Y., K. Vijayaraghavan, J-P. Huang and M.Z. Jacobson, Probing into Regional O3 and PM Pollution: A 1-year CMAQ Simulation and Process Analysis over the United States, 86th Annual Meeting of the American Meteorological Society, January 30 – February 2, 2006, Atlanta, Georgia.