Download
1 / 1
10 likes | 123 Views
T. Sonnemann 1, 2 , M. Knapmeyer 1 and J. Oberst 1 1 Institute of Planetary Research, German Aerospace Center (DLR), 2 Westfälische Wilhelms-Universität Münster. Westfälische Wilhelms Universität Münster. 2. Stacking

E N D
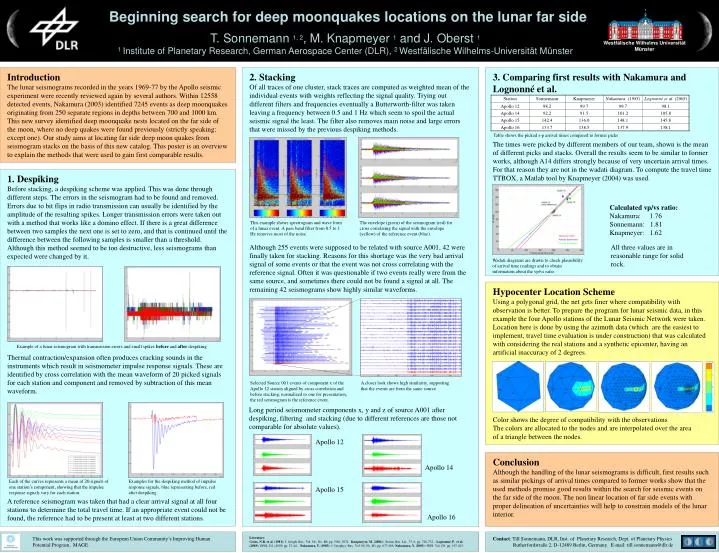
T. Sonnemann 1, 2, M. Knapmeyer 1 and J. Oberst 1 1 Institute of Planetary Research, German Aerospace Center (DLR), 2 Westfälische Wilhelms-Universität Münster Westfälische Wilhelms Universität Münster 2. Stacking Of all traces of one cluster, stack traces are computed as weighted mean of the individual events with weights reflecting the signal quality. Trying out different filters and frequencies eventually a Butterworth-filter was taken leaving a frequency between 0.5 and 1 Hz which seem to spoil the actual seismic signal the least. The filter also removes main noise and large errors that were missed by the previous despiking methods. Although 255 events were supposed to be related with source A001, 42 were finally taken for stacking. Reasons for this shortage was the very bad arrival signal of some events or that the event was not cross correlating with the reference signal. Often it was questionable if two events really were from the same source, and sometimes there could not be found a signal at all. The remaining 42 seismograms show highly similar waveforms. Introduction The lunar seismograms recorded in the years 1969-77 by the Apollo seismic experiment were recently reviewed again by several authors. Within 12558 detected events, Nakamura (2003) identified 7245 events as deep moonquakes originating from 250 separate regions in depths between 700 and 1000 km. This new survey identified deep moonquake nests located on the far side of the moon, where no deep quakes were found previously (strictly speaking: except one). Our study aims at locating far side deep moon quakes from seismogram stacks on the basis of this new catalog. This poster is an overview to explain the methods that were used to gain first comparable results. 3. Comparing first results with Nakamura and Lognonné et al. The times were picked by different members of our team, shown is the mean of different picks and stacks. Overall the results seem to be similar to former works, although A14 differs strongly because of very uncertain arrival times. For that reason they are not in the wadati diagram. To compute the travel time TTBOX, a Matlab tool by Knapmeyer (2004) was used. Beginning search for deep moonquakes locations on the lunar far side Table shows the picked s-p arrival times compared to former picks 1. Despiking Before stacking, a despiking scheme was applied. This was done through different steps. The errors in the seismogram had to be found and removed. Errors due to bit flips in radio transmission can usually be identified by the amplitude of the resulting spikes. Longer transmission errors were taken out with a method that works like a domino effect. If there is a great difference between two samples the next one is set to zero, and that is continued until the difference between the following samples is smaller than a threshold. Although this method seemed to be too destructive, less seismograms than expected were changed by it. Thermal contraction/expansion often produces cracking sounds in the instruments which result in seismometer impulse response signals. These are identified by cross correlation with the mean waveform of 20 picked signals for each station and component and removed by subtraction of this mean waveform. A reference seismogram was taken that had a clear arrival signal at all four stations to determine the total travel time. If an appropriate event could not be found, the reference had to be present at least at two different stations. Calculated vp/vs ratio: Nakamura: 1.76 Sonnemann: 1.81 Knapmeyer: 1.62 This example shows spectrogram and wave form of a lunar event. A pass band filter from 0.5 to 1 Hz removes most of the noise. The envelope (green) of the seismogram (red) for cross correlating the signal with the envelope (yellow) of the reference event (blue). All three values are in reasonable range for solid rock. Wadati diagrams are drawn to check plausibility of arrival time readings and to obtain information about the vp/vs ratio. Hypocenter Location Scheme Using a polygonal grid, the net gets finer where compatibility with observation is better. To prepare the program for lunar seismic data, in this example the four Apollo stations of the Lunar Seismic Network were taken. Location here is done by using the azimuth data (which are the easiest to implement, travel time evaluation is under construction) that was calculated with considering the real stations and a synthetic epicenter, having an artificial inaccuracy of 2 degrees. Color shows the degree of compatibility with the observations The colors are allocated to the nodes and are interpolated over the area of a triangle between the nodes. Example of a lunar seismogram with transmission errors and small spikes before and after despiking Selected Source 001 events of component x of the Apollo 12 station aligned by cross correlation and before stacking, normalized to one for presentation, the red seismogram is the reference event. A closer look shows high similarity, supporting that the events are from the same source. Long period seismometer components x, y and z of source A001 after despiking, filtering and stacking (due to different references are those not comparable for absolute values). Apollo 12 Conclusion Although the handling of the lunar seismograms is difficult, first results such as similar pickings of arrival times compared to former works show that the used methods promise good results within the search for seismic events on the far side of the moon. The non linear location of far side events with proper delineation of uncertainties will help to constrain models of the lunar interior. Apollo 14 Each of the curves represents a mean of 20 signals of one station’s component, showing that the impulse response signals vary for each station. Examples for the despiking method of impulse response signals, blue representing before, red after despiking. Apollo 15 Apollo 16 This work was supported through the European Union Community’s Improving Human Potential Program, MAGE. Literature: Goins, N.R. et al. (1981): J. Geoph. Res., Vol. 86., No. B6, pp. 5061-5074. Knapmeyer, M. (2004): Seism. Res. Let., 75, 6, pp. 726-732., Lognonné, P. et al. (2003): EPSL 211 (2003) pp. 27-44., Nakamura, Y. (1983): J. Geophys. Res., Vol. 88, No. B1, pp. 677-686. Nakamura, Y. (2003): PEPI, Vol.139, pp. 197-205. Contact: Till Sonnemann, DLR, Inst. of Planetary Research, Dept. of Planetary Physics Rutherfordstraße 2, D-12489 Berlin, Germany. E-mail: till.sonnemann@dlr.de