Download
1 / 55
550 likes | 677 Views
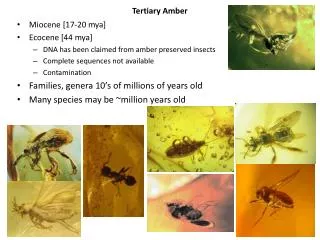
AMBER. Areal Mean Basin Estimated Rainfall COMAP Flash Flood Course Robert S. Davis, Pittsburgh WFO. AMBER Overview. All watersheds in county warning area are defined to a Minimum Basin Area (MBA) of 2 mi 2 to show spatial rainfall distribution.

E N D
AMBER Areal Mean Basin Estimated Rainfall COMAP Flash Flood Course Robert S. Davis, Pittsburgh WFO
AMBER Overview • All watersheds in county warning area are defined to a Minimum Basin Area (MBA) of 2 mi2 to show spatial rainfall distribution. • The WSR-88D polar grid (1o by 1km) is mapped to the defined watersheds. • Average Basin Rainfall (ABR) is computed for each watershed every volume scan. • An hourly ABR rate is determined from the single volume scan (5-6 min.) of ABR.
National Basin Delineation • 30Sep1999 – NWS agrees to fund the AMBER National Basin Delineation project by NSSL for all of the United States. • ArcInfo used to define the watershed boundaries. • USGS 1 arc second (30 m) DEM data supplied by EROS Data Center. • www.nssl.noaa.gov/teams/western/basins
AMBER Watershed Division • All watersheds in the county warning area are divided into hydrologic segments no larger than 10 mi2. • A Minimum Basin Area of 2 mi2 is used in the initial NSSL stream creation procedure. • Each forecast office may modify the NSSL stream database (subdivide or aggregate).
Flash Flood Monitoring and Prediction (FFMP) in AWIPS • Build 5.0: FFMP will compare DPA rainfall with FFG (HRAP 4 km x 4km grid). No ABR computations. • Build 5.1 FFMP will compute AMBER ABR and ABR Rate, using the DHR product (1o x 1 km polar grid) and the NSSL NBD watersheds.
Digital Radar Data • Radar provides 3 rainfall measurements, location, time, and quantitative estimate. • Radar grid size determines accuracy of location and MBA for ABR computation. • Sample rate determines time interval, but product time interval may be larger. • Z/R relationship determines rainfall estimate. (Sources of error important!!)
Digital Precipitation Array • Time interval (1 hour) • Data grid size (HRAP 4 km x 4 km grid) • Rainfall estimates in the WSR-88D polar grid (1 degree x 2 km) are averaged to produce a single rainfall estimate in each HRAP grid. • Used by the RFC for Stage 1, Stage 2, and Stage 3 precipitation estimation.
Digital Hybrid Scan Reflectivity (DHR) • Time interval (5-6 minutes) • Grid size (1 degree x 1 km) • Reflectivity to the nearest 0.5 dBZ
DHR WSR-88D Bin AssignmentPolar grid 1 degree x 1km • DHR grid is mapped to all defined watershed segments. This allows ABR computation in 5-6 minute time steps. • DHR grid is mapped to all defined urban areas to compute ABR urban rainfall. • Single 1km DHR bins are assigned to location of all rain gages, allowing gage comparison with radar estimated rainfall.
Flash Flood Threat and ABR • Severity of flash flooding is directly related to the observed ABR in a watershed. • The time period of the ABR determines the ABR rate. The higher the ABR rate, the greater the risk of serious flash flooding. • ABR varies as function of watershed area. As watershed area increases, ABR and ABR rate tend to decrease.
ABR Rate • Based on 5-6 minute observed ABR. • Hourly ABR Rate = ABR x 3600/vsec, where vsec= the number of seconds in the volume scan. • ABR Rate is used to identify watersheds currently receiving the heaviest rainfall, before the flash flood producing accumulation occurs.
Pittsburgh Urban Flash Flood May 18, 1999
AMBER Time Display Interval • 5-minute ABR: Used to compute ABR Rate and to sum the ABR through a 2 hour time period. • 15-minute ABR: Used for comparison with IFLOWS rain gage data and to sum the ABR through a 6 hour time period. • 1-hour ABR: Used for history of ABR in a watershed and to sum ABR through a 24 hour time period.
24 Hour ABR-Rainfall History • The history of ABR in a watershed for the past 24 hours can be compared with the MAP rainfall used to update FFG. • The AMBER 24 hour ABR product can be used to determine the rainfall distribution in any watershed for the previous 24-72 hours. • ABR is displayed in one hour increments with a running 24 hour total.
Turtle Creek(1) #1108 X.XX = ABR 18MAY1999 2000 UTC- 19MAY1999 0200 UTC x.x = Area (square miles) Braddock Lock Monongahela River 3.03 6336 2.12 6597 1.75 3.1 2.8 (inches) 6334 6335 3.22 1.81 3.8 6598 1.8 2.46 5322 2.7 5321 4.28 4.40 2.3 2.4 6599 6309 Kenmore Ave. 3.76 3.09 0.9 Electric Ave. 6310 Pitcairn 6605 0.7 3.09 5.09 0.5 0.2 6596 Turtle Creek 3.72 1.4
Forest Hills EMA Reports • 2215 UTC - First reports of water in basements. • 2300 - 0100 UTC many cars stranded along Ardmore Boulevard. • 0056 UTC - 10/homes/20 people evacuated on Kenmore Avenue.
Mon Valley Urban AreasTotal population 86,565 • Rankin/Braddock 8,256 3.0mi2 • Clairton 12,188 1.3mi2 • McKeesport 31,012 2.0mi2 • Glassport 6,242 1.2mi2 • Port Vue 5,316 0.9mi2 • Wilson/Dravosburg 11,075 0.8mi2 • Duquesne 10,094 1.4mi2 • Liberty 3,112 2.2mi2
AMBER Z/R Gage Comparison • The single 1km DHR bin that contains the rain gage is used to compute the radar rainfall estimate. • Tropical vs. Standard Z/R usage can be estimated using 15 minute gage data. • Gage comparisons should be done to verify validity of the WSR-88D rainfall estimates.
Tropical Z/R Cases • Standard Z/R: Z = 300R1.4 • Tropical Z/R: Z = 250R1.2 • Maximum Rate Cap 5.0 in/hr? • Tropical Storm not required!!!
Recent Tropical Z/R Cases • Dallas, TX 05 May 1995 • Fort Collins, CO 28-29 July 1997 • Kansas City, MO/KN 05 October 1998
Kansas City, Mo Flash Flood 04-05October1998 The great Sunday night football flood
Kansas City, MO Flash Flood04-05October1998 • Severe flash flooding occurred on the Brush Creek and Turkey Creek watersheds. • AMBER divides these two watersheds into 9 distinct hydrologic areas and computes Average Basin Rainfall (ABR) in each area. • The next two slides depict the AMBER ABR using the standard and tropical Z/R rates.
AMBER Z/R Gage Comparison • AMBER uses the single 1o by 1km WSR-88D range bin that contains the rain gage. • ABR is computed for this single bin and compared to the rain gage amount. • The Skywarn observer is located in the range bin centered on 292.5o at 46.5 km. • Area of the range bin at 46.5 km is 0.3 mi2.