Download
1 / 1
10 likes | 113 Views
Shelf ( <200 m ) Upper slope ( 200-600 m ) Lower slope ( 600-1000 m ) Base of slope ( >1000 m ). Air. Gaoping River input (POC+PIC) =2.92x10 10 mol C/yr. Photic zone. Primary production. Water. Total input (sedimentary flux) =6.4x10 9 mol C/yr. Diffusion flux (DOC+DIC)

E N D
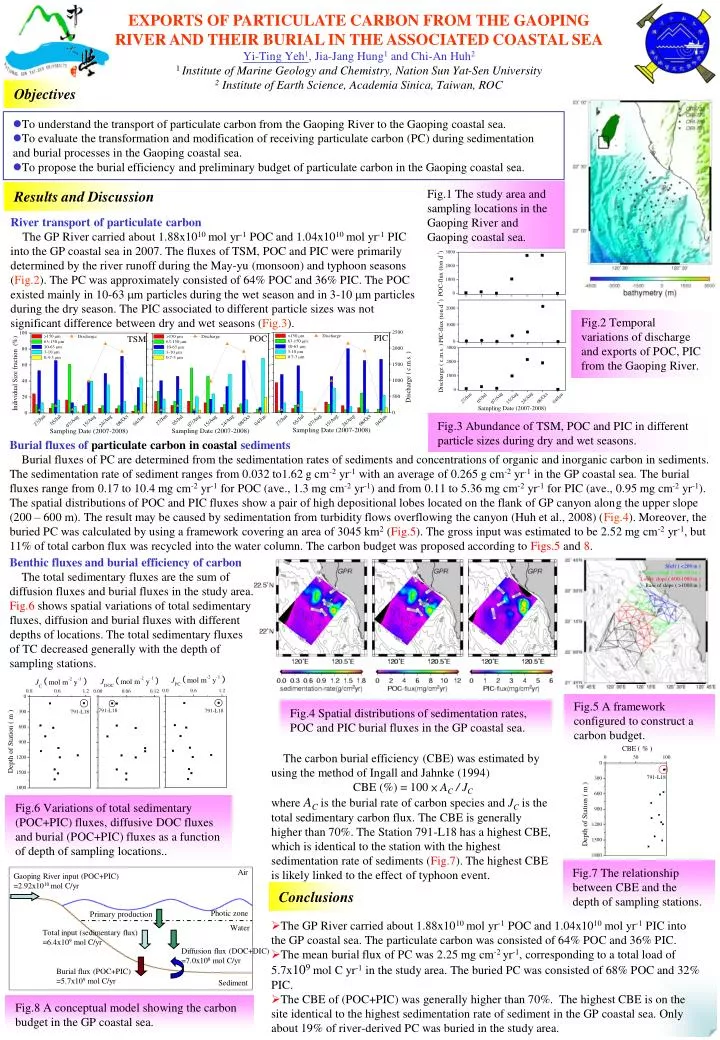
Shelf ( <200 m ) Upper slope ( 200-600 m ) Lower slope ( 600-1000 m ) Base of slope ( >1000 m ) Air Gaoping River input (POC+PIC) =2.92x10¹⁰ mol C/yr Photic zone Primary production Water Total input (sedimentary flux) =6.4x10⁹ mol C/yr Diffusion flux (DOC+DIC) =7.0x10⁸ mol C/yr Burial flux (POC+PIC) =5.7x10⁹ mol C/yr Sediment EXPORTS OF PARTICULATE CARBON FROM THE GAOPING RIVER AND THEIR BURIAL IN THE ASSOCIATED COASTAL SEA Yi-Ting Yeh1, Jia-Jang Hung1 and Chi-An Huh2 1Institute of Marine Geology and Chemistry, Nation Sun Yat-Sen University 2 Institute of Earth Science, Academia Sinica, Taiwan, ROC Objectives • To understand the transport of particulate carbon from the Gaoping River to the Gaoping coastal sea. • To evaluate the transformation and modification of receiving particulate carbon (PC) during sedimentation and burial processes in the Gaoping coastal sea. • To propose the burial efficiency and preliminary budget of particulate carbon in the Gaoping coastal sea. Fig.1 The study area and sampling locations in the Gaoping River and Gaoping coastal sea. Results and Discussion River transport of particulate carbon The GP River carried about 1.88x10¹⁰mol yr-1 POC and 1.04x10¹⁰mol yr-1 PIC into the GP coastal sea in 2007. The fluxes of TSM, POC and PIC were primarily determined by the river runoff during the May-yu (monsoon) and typhoon seasons (Fig.2). The PC was approximately consisted of 64% POC and 36% PIC. The POC existed mainly in 10-63 mm particles during the wet season and in 3-10 mm particles during the dry season. The PIC associated to different particle sizes was not significant difference between dry and wet seasons (Fig.3). Fig.2 Temporal variations of discharge and exports of POC, PIC from the Gaoping River. Fig.3 Abundance of TSM, POC and PIC in different particle sizes during dry and wet seasons. Burial fluxes of particulate carbon in coastal sediments Burial fluxes of PC are determined from the sedimentation rates of sediments and concentrations of organic and inorganic carbon in sediments. The sedimentation rate of sediment ranges from 0.032 to1.62 g cm-2 yr-1 with an average of 0.265 g cm-2 yr-1 in the GP coastal sea. The burial fluxes range from 0.17 to 10.4 mg cm-2 yr-1 for POC (ave., 1.3 mg cm-2 yr-1) and from 0.11 to 5.36 mg cm-2 yr-1 for PIC (ave., 0.95 mg cm-2 yr-1). The spatial distributions of POC and PIC fluxes show a pair of high depositional lobes located on the flank of GP canyon along the upper slope (200 – 600 m). The result may be caused by sedimentation from turbidity flows overflowing the canyon (Huh et al., 2008) (Fig.4). Moreover, the buried PC was calculated by using a framework covering an area of 3045 km2 (Fig.5). The gross input was estimated to be 2.52 mg cm-2 yr-1, but 11% of total carbon flux was recycled into the water column. The carbon budget was proposed according to Figs.5 and 8. Benthic fluxes and burial efficiency of carbon The total sedimentary fluxes are the sum of diffusion fluxes and burial fluxes in the study area. Fig.6 shows spatial variations of total sedimentary fluxes, diffusion and burial fluxes with different depths of locations. The total sedimentary fluxes of TC decreased generally with the depth of sampling stations. Fig.5 A framework configured to construct a carbon budget. Fig.4 Spatial distributions of sedimentation rates, POC and PIC burial fluxes in the GP coastal sea. The carbon burial efficiency (CBE) was estimated by using the method of Ingall and Jahnke (1994) CBE (%) = 100 × AC / JC where AC is the burial rate of carbon species and JC is the total sedimentary carbon flux. The CBE is generally higher than 70%. The Station 791-L18 has a highest CBE, which is identical to the station with the highest sedimentation rate of sediments (Fig.7). The highest CBE is likely linked to the effect of typhoon event. Fig.6 Variations of total sedimentary (POC+PIC) fluxes, diffusive DOC fluxes and burial (POC+PIC) fluxes as a function of depth of sampling locations.. Fig.7 The relationship between CBE and the depth of sampling stations. Conclusions • The GP River carried about 1.88x10¹⁰ mol yr-1 POC and 1.04x10¹⁰ mol yr-1 PIC into the GP coastal sea. The particulate carbon was consisted of 64% POC and 36% PIC. • The mean burial flux of PC was 2.25 mg cm-2 yr-1, corresponding to a total load of 5.7x10⁹ mol C yr-1 in the study area. The buriedPC was consisted of 68% POC and 32% PIC. • The CBE of (POC+PIC) was generally higher than 70%. The highest CBE is on the site identical to the highest sedimentation rate of sediment in the GP coastal sea. Only about 19% of river-derived PC was buried in the study area. Fig.8 A conceptual model showing the carbon budget in the GP coastal sea.