Download
1 / 9
100 likes | 280 Views
Warm-up 8.1 Estimating Proportion with Confidence. 1. a. Free Response Answers to Ch. 7 Reviewsheet. b. Male score of 560 is more likely. c. 2. a. b. 8.1 Estimating Proportion with Confidence. The Pew Research Center found that 55%of singles ages

E N D
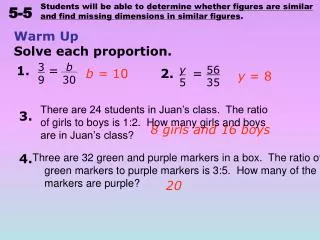
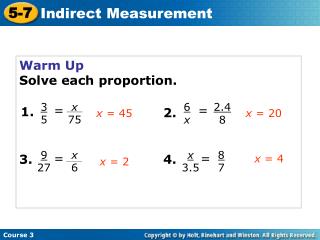
1. a. Free Response Answers to Ch. 7 Reviewsheet b. Male score of 560 is more likely. c.
2. a. b.
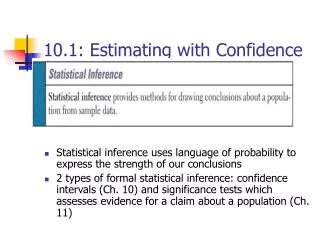
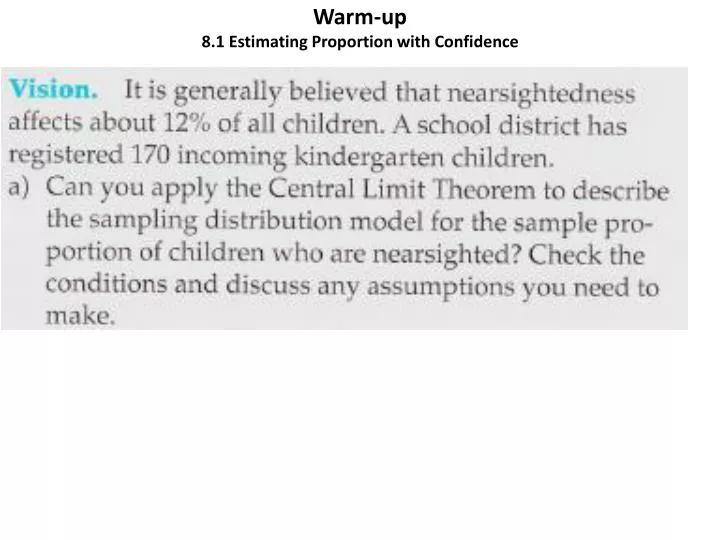
8.1 Estimating Proportion with Confidence The Pew Research Center found that 55%of singles ages 18–29 say that they aren’t in a committed relationship and are not actively looking for a romantic partner. This percentage is based on interviews with 1068 singles. The researchers are 95%confident. What, exactly, can they mean by this? The answer involves the concept of reasonably likely events.
How Confidence Intervals are used in relation to proportions Coral reefs are an integral part of marine life. Scientists say that 10% of the world’s reef systems have been destroyed in recent times. At current rates of loss, 70% of the reefs could be gone in 40 years. Scientists sampled a specific kind of coral called a sea fan out of Las Redes Reef in Akumal, Mexico. They found that 54 out of the 104 sea fans sampled were diseased. Find the confidence interval and list the strongest to weakest statements that can be made based on the given on the information above.
Rank the following statements 1. 51.9% of all sea fans on the Las Redes Reef are infected. 2. It is probably true that 51.9% of all se fans on the Las Redes Reef are infected. 3. We don’t know exactly what proportion of sea fans on the Las Redes Reef is infected but we know that it’s within the interval of 51.9% + 4.9%. That is, it’s between 42.1% and 61.7% 4. We don’t know exactly what proportion of sea fans on Las Redes Reef is infected, but the interval from 42.1% to 61.7% probably contains the true proportion. _____ , ______ , _____ , _____ Strongest … to … Weakest Can you come up with a better statement?
Using expected Values instead of proportion Suppose 35% of a population think they pay too much for car insurance. A polling organization takes a random sample of 500 people from this population and computes the sample proportion, p-hat , of people who think they pay too much for car insurance. There is a 95% chance that p-hat will between what numbers of people polled in a 500 person sample?
H.W. and Test Preparation Read 8.1 define terms and copy formulas. Prepare 3x5 index card for the test. Be sure to write your name on it. I highly recommend you read the Ch. 7 Summary (pg 458) complete the Ch. 7 Review Questions (pg 460) and A.P. Sample Test (pg 464) in preparation for the test. I will be posting answers to the A.P. Sample Test on Sharepoint