Download
1 / 25
250 likes | 307 Views
State Funding & Financial Planning: Budget Leaders 03/24/10. State Budget Context. March 2010 State Forecast. Beginning a slow recovery FY 2009-10 $6.5 -$6.7 billion revenue projections No further reductions FY 2010-11 $7.1 billion revenue projection

E N D
March 2010 State Forecast • Beginning a slow recovery • FY 2009-10 • $6.5 -$6.7 billion revenue projections • No further reductions • FY 2010-11 • $7.1 billion revenue projection • One-time budget balancing: $212.2-$320.6 million • FY 2011-12 Legislative Council estimate of cliff, without caseload adjustments, $580 million
Governor Ritter 2/18/2010:Tough Choices • 97% of the FY 2010-11 General Fund request is devoted to just five areas of service: • 43.0%, K-12 Education is the largest component of the General Fund budget and was off limits when balancing in FY 2009-10 due to a required 5% General Fund increase. • 19.9%, Health Care Policy and Financing provides services that are mostly entitlement programs that have a counter-cyclical relationship with the economy. • When the economy goes down, Medicaid enrollments go up. • 9.2%, Human Services are provided to the state’s most vulnerable and highest risk populations such as those with developmental disabilities or mental illness, juvenile delinquents, and children who are the victims of abuse and neglect. • 15.5%, Corrections, Public Safety and Judicial provide public safety services and staffing levels that were reduced during the last recession have still not been restored. Judicial staffing was increased pursuant to HB 07-1054. • 9.4%, Higher Education is one of the last remaining areas of the budget where there continues to be budgetary flexibility and where funding has been temporarily maintained with federal stimulus funds. Source: Governor's Office of State Planning
Colorado DHE: Higher Education Funding Total Higher Education Funding in Millions
Colorado DHE: UNC Funding Federal Funds ? State Funds UNC Funding in Millions
State Funding: One Piece of The Puzzle University Budget $170 million *Does not include Sponsored Program Budget $10 million
UNC University Revenues $170 M (millions)
University Revenues $170 M (millions)
UNC Student Revenue $109.5 M (millions)
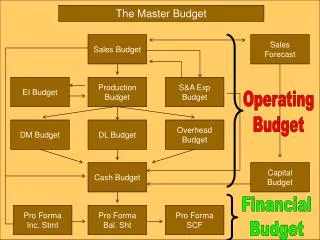
University Budget Uses University Budget Revenue Sources State Students: Tuition, Fees, Room & BoardMiscellaneous Capital Appropriations Operating Budget • Regular Operating Expenses • Debt Service (Bonds & Capital Leases) • Transfer to reserves • Transfer to capital projects • Prior year roll-forward retained by units • Centrally allocated one-time expenses • Contingency Innovation Budget • One-time investments and incentives Capital Budget
3-Year Financial What If? • Revenue • On-campus enrollment grows (12% UG/17% GR) and tuition rates increase 9% annually • Extended Studies revenue grows by $3 million • Room & Board revenue grows by 11% • The state funding cliff is $23 million (FY10 state funding remains constant with no more federal funds) • Discounting • 25% of new UG and GR tuition is used for increases in institutional discounting • 16% of new Room & Board revenue is used for increased discounting
3-Year Financial What If? • Expenses • Salaries increase 0% in FY11 and 3% in FY12 & FY13 • Fringe benefits increase 10% annually • We invest an additional $3 million in faculty/adjunct costs for on-campus and Extended Studies • Cost of sales increases 3% annually • Utilities increase $0.5 million • We make $1 million investment in incentives and growth • Debt service increases $1 million • OCE/Travel/Capital remains the same
UNC’s Reserve Status * Projected from On-campus Tuition, Extended Studies, Room & Board
FY11 Budget Topics • Pricing / Discounting • Internal Charging • Unfunded/Unbudgeted Operations & Impact of Prior Reductions • Short-term Capital • Quality of Life Student Fee • Extended Studies • Course/Library/Tech Fees • Summer & Interim Session
SB146 PERA Contribution Change • What is the impact of SB146 on UNC? • Employees • University