Download
1 / 34
340 likes | 439 Views
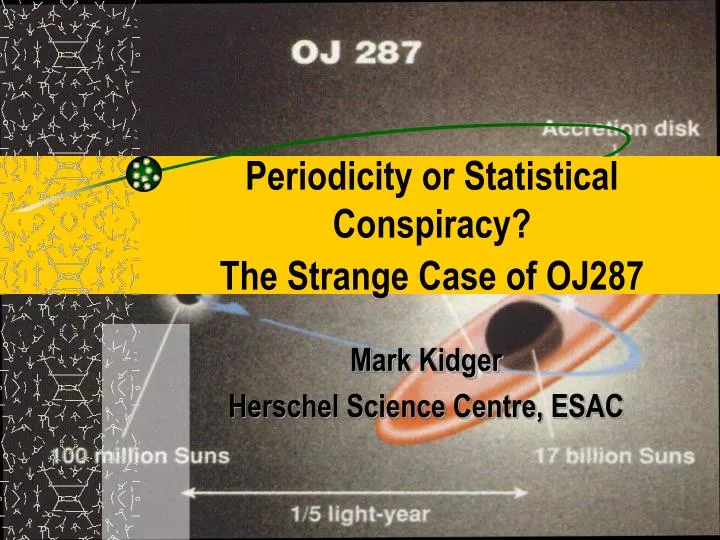
Periodicity or Statistical Conspiracy? The Strange Case of OJ287. Mark Kidger Herschel Science Centre, ESAC. What is OJ287?. OJ287 was first detected as a flat spectrum radio source in the Ohio surveys in 1968. It was identified with a 15 th magnitude compact blue object.

E N D
Periodicity or Statistical Conspiracy?The Strange Case of OJ287 Mark Kidger Herschel Science Centre, ESAC
What is OJ287? • OJ287 was first detected as a flat spectrum radio source in the Ohio surveys in 1968. • It was identified with a 15th magnitude compact blue object. • The optical spectrum was found to be featureless, but very weak variable emission lines have since been detected with a red shift of z=0.306. • OJ287 was classified as a BL Lac Object and, later, as a blazar.
What is OJ287? • OJ287 seems to be an exceptional object in that its relativistic jet is closer to our line of sight than any other AGN – we look down the throat of the jet. • There is a very high degree of relativistic beaming. • The host galaxy is barely detectable, even at 2 microns. DSS Near IR
Why is OJ287 interesting? • OJ287 is highly variable at all wavelengths from the centimetric to x-rays (and probably gamma rays). • The variability can be extremely violent – 50% or more in flux on time scales of less than an hour. • There is even a report of a 0.8 mag variation in the near-IR in 50 seconds!
Variation since identification • The optical light curve is characterised by occasional large outbursts and lower amplitude variability on all time scales. • There is a strong suggestion of long-term trends in the light curve.
But not all outbursts are the same? • Slow, long-term variations in the colour index suggest that there are occasional large injections into the jet of relativistic electrons that then slowly decay radiatively. • There appears to be a long-term colour index change related to the large optical outburst in 1972. • But, not all outbursts affect the colour index – the 1983 outburst appears not to have affected the overall trend, nor have those of 1994 & 2005. • Expected if the injections occur in the jet, but the outbursts in the accretion disk.
Long-term variability • Light curve data for OJ287 exists since 20/01/1892 from archival photographic plates, although the level of sampling and data quality are much greater since identification. • Large outbursts are seen back to at least 1913.
A suggestion of periodicity • In 1988 Mauri Valtonen, Aimo Sillänpää at Tuorla Observatory in Finland noticed that the outbursts appeared to repeat at regular intervals. • They suggested that there was a period of 11.60.5 years and that the outbursts were due to the interaction of a binary supermassive singularity with an eccentric orbit.
Predictive power? • The 11.6 year period predicted correctly that a new outburst would occur in November 1994. • The maximum was also correctly predicted to be smaller than the 1983 outburst, according to the apparent 60-year modulation of amplitude. • This was a success for the model and widely regarded as confirming the periodicity.
Low frequency cut-off • Monitoring at radio frequencies shows that there was a pronounced low-frequency cut-off. • Only the second maximum, in November 1995, is seen in radio. • No outburst is seen at all at 4.8GHz. • The amplitude is very much greater at 22GHz than at 14GHz.
But is it that simple? • The optical-infrared outburst showed a double maximum with separation 13 months. • Only the second maximum is seen in the radio data. • Even at 860GHz there is no evidence of the first maximum. • OJ287 (apparently) was not in outburst in 1994 in ISO data, but the outburst is seen clearly at 2.2 microns.
Total indifference! Outburst Quiescent
Amplitude v wavelength • Time averages in each frequency range show how the amplitude of variation changes with wavelength. • The width of the band gives the amplitude of variation. • The amplitude increases rapidly from the centimetric to the millimetric, but is highest in the visible/near-IR.
Time variation of the SED • Major changes are seen in the mean spectral energy distribution over the outburst. • On some occasions the spectrum becomes sharply peaked in the millimetric. • On others it is flat, or even increases to low frequencies.
But are the outbursts periodic? • Traditional methods of light curve periodic analysis (FFT, Deeming, etc.) do not work. • The light curve sampling has increased from <1 point per year in 1900 to 5600 points per year from 1993-95. • The error on each point has decreased by a factor of 10. • The Fourier Transform is totally dominated by data since 1972 (the 1993-95 data has 104-105 times more weight in the archive than the oldest data). • The method of data treatment affects the results obtained. • Although the outbursts have been “periodic” since 1972, only about three complete cycles have been observed – the historical data is critical in the light curve analysis.
The “exact” 11.6 year period seems to be a due to a statistical conspiracy. • There is no evidence for the Sillanpää period in the light curve before 1948.
The Lehto & Valtonen Model • Lehto & Valtonen (1996, ApJ, 460, 207) and Valtonen & Lehto (1997, ApJ, 481, L5), etc. propose • A binary singularity with masses 17x109 and 108M. • A rest frame orbital period of 8.9 years. • Eccentric orbit. • Pericentre advance 35º per orbit. • Superflares due to massive infall from the accretion disk caused by gravitational perturbations at pericentre. • Lifetime against decay by emission of gravitational radiation of 106 years. • Implies progressive decrease of period (1 week/orbit).
Open Questions in 2004 • How good is the predictive power of the model? • Is this true periodicity, or a pseudo-periodicity stable over a few cycles? • There were many predictions for the epoch of the next maximum (see Kidger, 2000, AJ, 119, 2053 for a summary). Most suggested that it will be between 2006.25 and 2006.75. • Much of this range is a period of poor visibility near conjunction, where radio observations would be crucial. • The secondary maximum in 2007 is also predicted to occur near conjunction. • Exact timing of the maxima should allow the model to be verified and refined. • Slightly different assumptions of initial parameters in the binary black hole model lead to very different predictions. • Consequence of the poor definition of the historical light curve.
Open Questions in 2004 • If the light curve is truly periodic, why is it that after >100 years there is such uncertainty in the period? • But, we have had only two well-observed outbursts (small number statistics!) • A lot of people have jumped on the periodicity bandwagon with ridiculously short data strings (20 years!!). • What is the relationship between the optical and radio outbursts? • Should alternatives to the binary black hole model such as a precessing jet perhaps be considered?
The 2006 outburst • The best-known prediction for the 2006 outburst (Pietilä, H. 1998, ApJ, 508, 669) and the periodic solution favour an outburst in summer 2006. • No coordinated monitoring programme has been organised to observe the outburst, unlike in 1993-1996. • At the 2005 AGM of the amateur “The Astronomer” Group in Basingstoke (England) a chance conversation with former British Astronomical Association Variable Star Section (BAA-VSS) Director, Gary Poyner, led us to set up an amateur monitoring campaign.
BAA-VSS Monitoring • The BAA-VSS has an archive of 343 observations of OJ287 from 1993 to mid-2005. • The majority are visual estimates made by the observer by eye at the telescope. • The first measure of the 2005-06 campaign was made on October 1st 2005. • 391 additional measures were made up to June 11th 2006 with telescopes from 20-50 cm. • 88 visual estimates • 186 unfiltered CCD measures • 55 CCD + V (8 in B, 25 in R, 29 in I)
Getting good quality data • The first step was to redefine the BAA-VSS sequence for OJ287. • One of the stars (#13) is now known to be a low amplitude variable. • There are 9 years of high precision BVRI photometry of the field stars from Teide Observatory that have been used. These tied down the faint end of the sequence. • Other CCD observations fixed the bright end.
Data quality checks • Quasisimultaneous data (t 1h) was used to check the zeropoint shift in the different V datasets. • As the colour variations of OJ287 are negligible the colour term can be ignored. • Mean colours in 2006 are (BV)=+0.62, (VR)=+0.44, similar to solar colours and slightly redder than historically. • Both unfiltered CCD and visual estimates had a significant zeropoint shift. • V = Visual + 0.14 • V = Unfiltered V + 0.09
Corrected amateur data • The corrected light curve shows an excellent agreement between filtered and unfiltered data. • The quality of the amateur data is excellent.
The campaign light curve • Initially we were disappointed to see a continuous fade rather than a slow rise to maximum. • OJ287 faded from V=13.6 on November 5th 2005 to V=16.1 on Feb. 16th 2006. • Several large flares are visible… • …but there was obviously no rise to a summer 2006 outburst.
Looking at the archive though, it was obvious that OJ287 was brighter in Nov. 2005 than at any time since March 1984.
The 2005 outburst • The peak of the 2005 outburst may have been missed, but even so the peak flux was higher than in 1994-95. • It is still a small outburst, at the minimum of the 60 year cycle. • It is advanced at least 10 months with respect to the 11.84 year period.
Bye bye stable period! • On a phase diagram the 1949, 1961, 1972, 1983 and 1994 maxima all line up for a stable 11.84 year period (red arrow). • Unless the 2005 maximum (blue arrow) is simply a precursor, there has been a large phase jump since 1994. • The 2005 maximum clearly does not fit a stable period.
The 2005 encounter • The Lehto & Valtonen model predicted that the 2005 encounter would be at low velocity and distant from the centre of the accretion disk. • A long delay from plane-crossing to optical flare. • A rather poorly defined maximum due to the encounter geometry. • A large advance in the date of the optical flare. 3295 test particles Path of secondary: 2005.19-2005.29
The 2005 encounter • Disk impact at 2005.09 • Primary accretion disk lifted 280AU out of plane. • Delay in optical flare 0.7yr. • Impact duration 0.23yr. • Secondary blast wave from impact reflection 0.2yr after impact. • Predicts that the 1994 maximum was at 1994.53! Impact Rebound Echo
Did we miss the 1994 outburst? • Superimposing the 2005 data on the 1994 light curve shows strong similarities, but the true 1994 maximum would have been hidden if it occurred when the revised model predicts Perhaps we only saw the initial rise towards maximum and an aftershock in 1994.
The revised model • The 2005 maximum has allowed the model parameters to be revised. • The mass of the primary increases from 17 to 19 billion solar masses. • The precession rate increases from 33º to 39º per orbit. • The fit to the early data improves greatly. • A second, sharp maximum from a high-velocity ascending node encounter should occur in 2007.
Conclusions • The 2005 outburst and pre-1948 data show that a periodic light curve model is not viable. • OJ287 will show periodicity for 50 years at a time, but no longer. • The periodicity has just broken down. • But the binary singularity model can explain this behaviour. • The lifetime of the system against gravitational radiation is 106 years There will be very few close AGN binaries. • The Lehto & Valtonen model is the only one that has accurately predicted the (unexpected) 2005 maximum.