Download
1 / 39
390 likes | 499 Views
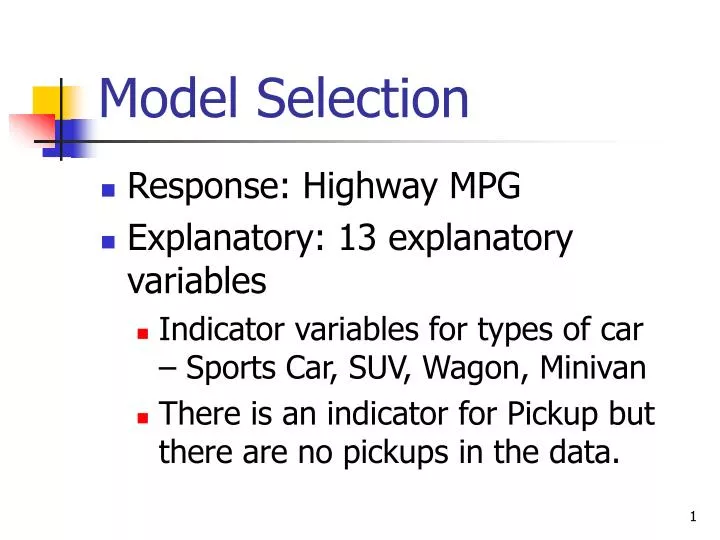
Model Selection. Response: Highway MPG Explanatory: 13 explanatory variables Indicator variables for types of car – Sports Car, SUV, Wagon, Minivan There is an indicator for Pickup but there are no pickups in the data. Indicator Variables.

E N D
Model Selection • Response: Highway MPG • Explanatory: 13 explanatory variables • Indicator variables for types of car – Sports Car, SUV, Wagon, Minivan • There is an indicator for Pickup but there are no pickups in the data.
Indicator Variables • The indicator variable takes on the value 1 if it is that kind of vehicle and 0 otherwise. • If all four indicator variables are 0, then the vehicle is a Sedan.
Explanatory Variables • Indicator variables for All Wheel and Rear Wheel drive. • If both indicator variables are 0, then the vehicle has Front Wheel drive.
Explanatory Variables • Engine size (liters) • Cylinders (number) • Horsepower • Weight (pounds) • Wheel Base (inches) • Length (inches) • Width (inches)
Forward Selection • Fit Model – Personality: Stepwise • Y, Response – Highway MPG • Put all 13 variables into the Construct Model Effects box. • Click on Run Model
Stepwise Fit • Stopping Rule: P-value Threshold • Prob to Enter = 0.050 • Prob to Leave = 0.050 • Direction: Forward • Click on Go
Forward Selection • Three variables are added • Weight • Horsepower • Wheel Base • All variables added are still statistically significant.
Forward Selection • Model with Weight, Horsepower and Wheel Base. • R2 = 0.6543, adj R2 = 0.6435 • RMSE = 3.635 • AICc = 548.45, BIC = 560.84 • Cp = 12.1222
Stepwise Fit • Stopping Rule: P-value Threshold • Prob to Enter = 0.050 • Prob to Leave = 0.050 • Direction: Backward • Enter All • Click on Go
Backward Selection • Eight variables are removed • Length, Rear Wheel, Wagon, Width, Engine, Wheel Base, Weight, Sports Car. • All variables left are statistically significant.
Backward Selection • Model with SUV, Minivan, All Wheel, Cylinders and Horsepower. • R2 = 0.6874, adj R2 = 0.6708 • RMSE = 3.493 • AICc = 542.96, BIC = 559.98 • Cp = 6.1511
Backward Selection • The final model from Backward selection is better than the final model from Forward selection. It has a higher R2 value, higher adj R2 value, lower RMSE, AICc, BIC and Cp value.
Mixed Selection (Forward) • Stopping Rule: P-value Threshold • Prob to Enter = 0.050 • Prob to Leave = 0.050 • Direction: Mixed • Click on Go
Mixed Selection (Forward) • Three variables are added • Weight • Horsepower • Wheel Base • No variables are removed. • This is the same as with Forward Selection.
Mixed Selection (Backward) • Stopping Rule: P-value Threshold • Prob to Enter = 0.050 • Prob to Leave = 0.050 • Direction: Mixed • Enter All • Click on Go
Mixed Selection (Backward) • Eight variables are removed • Length, Rear Wheel, Wagon, Width, Engine, Wheel Base, Weight, Sports Car. • No variables are added. • This is the same as with Backward Selection.
All Possible Models • 213 – 1 = 8191 models possible. • 1-variable models – listed in order of the R2 value. • 2-variable models – listed in order of the R2 value. • etc. • 13-variable (full) model.
All Possible Models • Can specify the maximum number of variables in a model. • Can specify the maximum number of models displayed for each number of variables.
All Possible Models • Model with all 13 variables has the highest R2 value. • R2 = 0.7145 • Is this the “best” model? • No, several variables are not statistically significant.
All Possible Models • Model with 7 variables has the lowest RMSE value. • Sports Car, SUV, Minivan, All Wheel, Cylinders, Horsepower, Weight • RMSE = 3.4282
Model with lowest RMSE • Is this the “best” model? • No, several variables are not statistically significant. • Sports Car: F=3.847, P-value=0.0529 • Horsepower: F=3.761, P-value=0.0555 • Weight: F=3.653, P-value=0.0591
All Possible Models • Model with 7 variables has the lowest Cp value. • Sports Car, SUV, Minivan, All Wheel, Cylinders, Horsepower, Weight • Cp = 4.7649 • This is the same model as the one with the lowest RMSE.
All Possible Models • Model with 7 variables has the lowest AICc and BIC values. • Sports Car, SUV, Minivan, All Wheel, Cylinders, Horsepower, Weight • AICc = 541.854, BIC = 563.301 • This is the same model as the one with the lowest RMSE and Cp.
Strategies • Start with the “best” 1-variable model. • Find a 2-variable model that beats it. • Find a 3-variable model that beats the “best” 2-variable model. • Etc.
Strategies • Start with the full (13-variable) model. Is it “best”? • Go to the 12-variable models. Are any of these “best”? • Etc.
“Best” Model • The 7-variable model with • SUV, Minivan, All Wheel, Engine, Horsepower, Weight and Wheel Base Appears to be the “best” model.
Prediction Equation Predicted Highway MPG = 30.74 – 3.15*SUV – 3.28*Minivan – 2.08*All Wheel – 1.65*Engine – 0.0226*Horsepower – 0.0029*Weight + 0.163*Wheel Base
Summary • All variables add significantly. • R2 = 0.705, adj R2 = 0.682 • RMSE = 3.431 • AICc = 542.01, BIC = 563.45 • Cp = 4.9011
Outlier • How do we determine if a potential outlier identified on the box plot is statistically significant?
Unusual Points in Regression • Outlier for Regression • A point with an unusually large residual.
Unusual Points in Regression • High leverage point. • A point with an extreme value for one, or more, of the explanatory variables
Influential Points • Does a point influence where the regression line goes? • An outlier can. • A high leverage point can. • Are they statistically significant?