Download
1 / 60
600 likes | 706 Views
Lectures 1: Review of Technology Trends and Cost/Performance. Prof. David A. Patterson Computer Science 252 Spring 1998. Original. Big Fishes Eating Little Fishes. 1988 Computer Food Chain. Mainframe. Work- station. PC. Mini- computer. Mini- supercomputer. Supercomputer.

E N D
Lectures 1: Review of Technology Trends and Cost/Performance Prof. David A. Patterson Computer Science 252 Spring 1998
Original Big Fishes Eating Little Fishes
1988 Computer Food Chain Mainframe Work- station PC Mini- computer Mini- supercomputer Supercomputer Massively Parallel Processors
1998 Computer Food Chain Mini- supercomputer Mini- computer Massively Parallel Processors Mainframe Work- station PC Server Now who is eating whom? Supercomputer
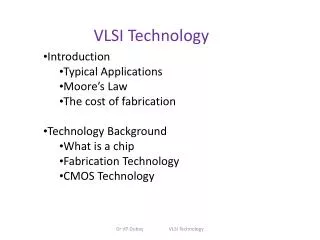
Why Such Change in 10 years? • Performance • Technology Advances • CMOS VLSI dominates older technologies (TTL, ECL) in cost AND performance • Computer architecture advances improves low-end • RISC, superscalar, RAID, … • Price: Lower costs due to … • Simpler development • CMOS VLSI: smaller systems, fewer components • Higher volumes • CMOS VLSI : same dev. cost 10,000 vs. 10,000,000 units • Lower margins by class of computer, due to fewer services • Function • Rise of networking/local interconnection technology
Technology Trends: Microprocessor Capacity “Graduation Window” Alpha 21264: 15 million Pentium Pro: 5.5 million PowerPC 620: 6.9 million Alpha 21164: 9.3 million Sparc Ultra: 5.2 million Moore’s Law • CMOS improvements: • Die size: 2X every 3 yrs • Line width: halve / 7 yrs
Memory Capacity (Single Chip DRAM) year size(Mb) cyc time 1980 0.0625 250 ns 1983 0.25 220 ns 1986 1 190 ns 1989 4 165 ns 1992 16 145 ns 1996 64 120 ns 2000 256 100 ns
Technology Trends(Summary) Capacity Speed (latency) Logic 2x in 3 years 2x in 3 years DRAM 4x in 3 years 2x in 10 years Disk 4x in 3 years 2x in 10 years
Processor PerformanceTrends 1000 Supercomputers 100 Mainframes 10 Minicomputers Microprocessors 1 0.1 1965 1970 1975 1980 1985 1990 1995 2000 Year
Performance Trends(Summary) • Workstation performance (measured in Spec Marks) improves roughly 50% per year (2X every 18 months) • Improvement in cost performance estimated at 70% per year
Measurement and Evaluation • Architecture is an iterative process: • Searching the space of possible designs • At all levels of computer systems Creativity Cost / Performance Analysis Good Ideas Mediocre Ideas Bad Ideas
Computer Architecture Topics Input/Output and Storage Disks, WORM, Tape RAID Emerging Technologies Interleaving Bus protocols DRAM Coherence, Bandwidth, Latency Memory Hierarchy L2 Cache L1 Cache Addressing, Protection, Exception Handling VLSI Instruction Set Architecture Pipelining and Instruction Level Parallelism Pipelining, Hazard Resolution, Superscalar, Reordering, Prediction, Speculation, Vector, DSP
Computer Architecture Topics Shared Memory, Message Passing, Data Parallelism P M P M P M P M ° ° ° Network Interfaces S Interconnection Network Processor-Memory-Switch Topologies, Routing, Bandwidth, Latency, Reliability Multiprocessors Networks and Interconnections
CS 252 Course Focus Understanding the design techniques, machine structures, technology factors, evaluation methods that will determine the form of computers in 21st Century Parallelism Technology Programming Languages Applications Interface Design (ISA) Computer Architecture: • Instruction Set Design • Organization • Hardware Operating Measurement & Evaluation History Systems
Topic Coverage Textbook: Hennessy and Patterson, Computer Architecture: A Quantitative Approach, 2nd Ed., 1996. • 1.5 weeks Review: Fundamentals of Computer Architecture (Ch. 1), Instruction Set Architecture (Ch. 2), Pipelining (Ch. 3) • 1 week: Pipelining and Instructional Level Parallelism (Ch. 4) • 2.5 weeks: Vector Processors and DSPs (Appendix B) • 1 week: Memory Hierarchy (Chapter 5) • 1.5 weeks: Input/Output and Storage (Chapter 6) • 1.5 weeks: Networks and Interconnection Technology (Chapter 7) • 1.5 weeks: Multiprocessors (Ch. 8 + Culler book draft Chapter 1) • Research Guest Lectures: Reconfigurable MPer(“BRASS”), DRAM+MPer(“IRAM”), Systems of Systems (“Millennium”)
CS252: Staff Instructor: David A. Patterson Office: 635 Soda Hall, 642-6587 patterson@cs Office Hours: Wed 3:30-4:30 or by appt. (Contact Tim Ryan, 643-4014, tryan@cs, 634 Soda ) T. A: Joe Gebis Office: ?? Soda Hall, 642-?? gebis @eecs TA Office Hours TBD Class: Wed, Fri 2:10:00 - 3:30:00 203 McLaughlin Text: Computer Architecture: A Quantitative Approach, Second Edition (1996) ( second printing) Web page: http://http.cs.berkeley.edu/~patterson/252/ Lectures available online <11:30AM day of lecture Newsgroup: ucb.class.c252
Lecture style • 1-Minute Review • 20-Minute Lecture • 5- Minute Administrative Matters • 25-Minute Lecture • 5-Minute Break (water, stretch) • 25-Minute Lecture • Instructor will come to class early & stay after to answer questions Attention 20 min. Break “In Conclusion, ...” Time
Grading • 30% Homeworks (work in pairs) • 30% Examinations (2 Midterms) • 30% Research Project (work in pairs) • Transition from undergrad to grad student • Berkeley wants you to succeed, but you need to show initiative • pick topic • meet 3 times with faculty/TA to see progress • give oral presentation • give poster session • written report like conference paper • 3 weeks work full time for 2 people • Opportunity to do “research in the small” to help make transition from good student to research colleague • 10% Class Participation
Course Style • Reduce the pressure of taking quizes • Only 2 Graded Quizes: Wednesday Mar. 4 and Wed. Apr. 22 • Our goal: test knowledge vs. speed writing • 3 hrs to take 1.5-hr test (5:30-8:30 PM, Sibley Auditorium) • Both mid-term quizes can bring summary sheet • Transfer ideas from book to paper • Last chance Q&A: during class time day of exam • Students/Staff meet over free pizza/drinks at La Vals: Wed Mar. 4 (8:30 PM) and Wed Apr 22 (8:30 PM)
Course Style • Everything is on the course Web page: www.cs.berkeley.edu/~pattrsn/252S98/index.html • Notes: • ASUC said today that the books would be in in less than 1 week. They can also be found in local book stores (Cody's and a few in Barnes and Noble), as well as at WWW bookstores. • The Handouts section of the CS152 homepage from Fall 1997 includes the midterms from this semester and as well as pointers to past exams. Solutions are included. • Schedule: • 2 Graded Quizes: Wednesday Mar. 4 and Wed. Apr. 22 • Project Reviews: Fri. Feb 25, Wed. Apr 1, Wed. Apr 15 • Oral Presentations: Thu/Fri April 30/May 1 1-7PM/1-5PM • 252 Poster Session: Wed May 6 • 252 Last lecture: Fri May 8 • Project Papers/URLs due: Mon May 11 • Project Suggestions
Basic knowledge of the organization of a computer is assumed! Related Courses Strong Prerequisite CS 152 CS 252 CS 258 Why, Analysis, Evaluation Parallel Architectures, Languages, Systems How to build it Implementation details CS 250 Integrated Circuit Technology from a computer-organization viewpoint
Coping with CS 252 • Spring 95 CS 252 = my worst teaching experience • Too many students with too varied background? • 60 students: • To give proper attention to projects (as well as homeworks and quizes), I can handle up to 36 students • Limiting Number of Students • First priority is first year CS/ EECS grad students • Second priority is N-th year CS/ EECS grad students • Third priority is College of Engineering grad students • Fourth priority is CS/EECS undegraduate seniors (Note: 1 graduate course unit = 2 undergraduate course units) • All other categories • If not this semester, 252 is offered regularily (Fall)
Coping with CS 252 • Students with too varied background? • In past, CS grad students took written prelim exams on undergraduate material in hardware, software, and theory • 1st 5 weeks reviewed background, helped 252, 262, 270 • Prelims were dropped => some unprepared for CS 252? • In class exam on Wednesday January 28 • Doesn’t affect grade, only admission into class • 2 grades: Admitted or audit/take CS 152 1st • Improve your experience if recapture common background • Review: Chapters 1- 3, CS 152 home page, maybe “Computer Organization and Design (COD)2/e” • Chapters 1 to 8 of COD if never took prerequisite • If did take a class, be sure COD Chapters 2, 6, 7 are familiar • Copies in Bechtel Library on 2-hour reserve
Computer Engineering Methodology Technology Trends
Computer Engineering Methodology Evaluate Existing Systems for Bottlenecks Benchmarks Technology Trends
Computer Engineering Methodology Evaluate Existing Systems for Bottlenecks Benchmarks Technology Trends Simulate New Designs and Organizations Workloads
Computer Engineering Methodology Evaluate Existing Systems for Bottlenecks Implementation Complexity Benchmarks Technology Trends Implement Next Generation System Simulate New Designs and Organizations Workloads
Measurement Tools • Benchmarks, Traces, Mixes • Hardware: Cost, delay, area, power estimation • Simulation (many levels) • ISA, RT, Gate, Circuit • Queuing Theory • Rules of Thumb • Fundamental “Laws”/Principles
DC to Paris Speed Passengers Throughput (pmph) 6.5 hours 610 mph 470 286,700 3 hours 1350 mph 132 178,200 The Bottom Line: Performance (and Cost) Plane Boeing 747 BAD/Sud Concodre • Time to run the task (ExTime) • Execution time, response time, latency • Tasks per day, hour, week, sec, ns … (Performance) • Throughput, bandwidth
The Bottom Line: Performance (and Cost) • "X is n times faster than Y" means • ExTime(Y) Performance(X) • --------- = --------------- • ExTime(X) Performance(Y) • Speed of Concorde vs. Boeing 747 • Throughput of Boeing 747 vs. Concorde
Amdahl's Law Speedup due to enhancement E: ExTime w/o E Performance w/ E Speedup(E) = ------------- = ------------------- ExTime w/ E Performance w/o E Suppose that enhancement E accelerates a fraction F of the task by a factor S, and the remainder of the task is unaffected
Amdahl’s Law ExTimenew = ExTimeold x (1 - Fractionenhanced) + Fractionenhanced Speedupenhanced 1 ExTimeold ExTimenew Speedupoverall = = (1 - Fractionenhanced) + Fractionenhanced Speedupenhanced
Amdahl’s Law • Floating point instructions improved to run 2X; but only 10% of actual instructions are FP ExTimenew= Speedupoverall =
Amdahl’s Law • Floating point instructions improved to run 2X; but only 10% of actual instructions are FP ExTimenew= ExTimeold x (0.9 + .1/2) = 0.95 x ExTimeold 1 Speedupoverall = = 1.053 0.95
Metrics of Performance Application Answers per month Operations per second Programming Language Compiler (millions) of Instructions per second: MIPS (millions) of (FP) operations per second: MFLOP/s ISA Datapath Megabytes per second Control Function Units Cycles per second (clock rate) Transistors Wires Pins
CPU time = Seconds = Instructions x Cycles x Seconds Program Program Instruction Cycle Aspects of CPU Performance Inst Count CPI Clock Rate Program X Compiler X (X) Inst. Set. X X Organization X X Technology X
Cycles Per Instruction “Average Cycles per Instruction” • CPI = (CPU Time * Clock Rate) / Instruction Count • = Cycles / Instruction Count Invest Resources where time is Spent! n CPU time = CycleTime * CPI * I i i i = 1 “Instruction Frequency” n CPI = CPI * F where F = I i i i i i = 1 Instruction Count
Example: Calculating CPI Base Machine (Reg / Reg) Op Freq Cycles CPI(i) (% Time) ALU 50% 1 .5 (33%) Load 20% 2 .4 (27%) Store 10% 2 .2 (13%) Branch 20% 2 .4 (27%) 1.5 Typical Mix
SPEC: System Performance Evaluation Cooperative • First Round 1989 • 10 programs yielding a single number (“SPECmarks”) • Second Round 1992 • SPECInt92 (6 integer programs) and SPECfp92 (14 floating point programs) • Compiler Flags unlimited. March 93 of DEC 4000 Model 610: spice: unix.c:/def=(sysv,has_bcopy,”bcopy(a,b,c)= memcpy(b,a,c)” wave5: /ali=(all,dcom=nat)/ag=a/ur=4/ur=200 nasa7: /norecu/ag=a/ur=4/ur2=200/lc=blas • Third Round 1995 • new set of programs: SPECint95 (8 integer programs) and SPECfp95 (10 floating point) • “benchmarks useful for 3 years” • Single flag setting for all programs: SPECint_base95, SPECfp_base95
How to Summarize Performance • Arithmetic mean (weighted arithmetic mean) tracks execution time: (Ti)/n or (Wi*Ti) • Harmonic mean (weighted harmonic mean) of rates (e.g., MFLOPS) tracks execution time: n/(1/Ri) or n/(Wi/Ri) • Normalized execution time is handy for scaling performance (e.g., X times faster than SPARCstation 10) • But do not take the arithmetic mean of normalized execution time, use the geometrici)^1/n)
5 minute Class Break • 80 minutes straight is too long for me to lecture (2:10:00 – 3:30:00): • 1 minute: review last time & motivate this lecture • 20 minute lecture • 3 minutes: discuss class manangement • 25 minutes: lecture • 5 minutes: break • 25 minutes: lecture • 1 minute: summary of today’s important topics
SPEC First Round • One program: 99% of time in single line of code • New front-end compiler could improve dramatically
Impact of Means on SPECmark89 for IBM 550 Ratio to VAX: Time:Weighted Time: Program Before After Before After Before After gcc 30 29 49 51 8.91 9.22 espresso 35 34 65 67 7.64 7.86 spice 47 47 510 510 5.69 5.69 doduc 46 49 41 38 5.81 5.45 nasa7 78 144 258 140 3.43 1.86 li 34 34 183 183 7.86 7.86 eqntott 40 40 28 28 6.68 6.68 matrix300 78 730 58 6 3.43 0.37 fpppp 90 87 34 35 2.97 3.07 tomcatv 33 138 20 19 2.01 1.94 Mean 54 72 124 108 54.42 49.99 Geometric Arithmetic Weighted Arith. Ratio 1.33 Ratio 1.16 Ratio 1.09
Performance Evaluation • “For better or worse, benchmarks shape a field” • Good products created when have: • Good benchmarks • Good ways to summarize performance • Given sales is a function in part of performance relative to competition, investment in improving product as reported by performance summary • If benchmarks/summary inadequate, then choose between improving product for real programs vs. improving product to get more sales;Sales almost always wins! • Execution time is the measure of computer performance!
Integrated Circuits Costs IC cost = Die cost + Testing cost + Packaging cost Final test yield Die cost = Wafer cost Dies per Wafer * Die yield Dies per wafer = * ( Wafer_diam / 2)2 – * Wafer_diam – Test dies Die Area ¦ 2 * Die Area Die Yield = Wafer yield * 1 + Defects_per_unit_area * Die_Area } { Die Cost goes roughly with die area4
Real World Examples Chip Metal Line Wafer Defect Area Dies/ Yield Die Cost layers width cost /cm2 mm2 wafer 386DX 2 0.90 $900 1.0 43 360 71% $4 486DX2 3 0.80 $1200 1.0 81 181 54% $12 PowerPC 601 4 0.80 $1700 1.3 121 115 28% $53 HP PA 7100 3 0.80 $1300 1.0 196 66 27% $73 DEC Alpha 3 0.70 $1500 1.2 234 53 19% $149 SuperSPARC 3 0.70 $1700 1.6 256 48 13% $272 Pentium 3 0.80 $1500 1.5 296 40 9% $417 • From "Estimating IC Manufacturing Costs,” by Linley Gwennap, Microprocessor Report, August 2, 1993, p. 15
Average Discount Gross Margin Component Cost Cost/PerformanceWhat is Relationship of Cost to Price? • Component Costs • Direct Costs(add 25% to 40%) recurring costs: labor, purchasing, scrap, warranty • Gross Margin(add 82% to 186%) nonrecurring costs: R&D, marketing, sales, equipment maintenance, rental, financing cost, pretax profits, taxes • Average Discountto get List Price (add 33% to 66%): volume discounts and/or retailer markup List Price 25% to 40% Avg. Selling Price 34% to 39% 6% to 8% Direct Cost 15% to 33%
Chip Prices (August 1993) • Chip Area Mfg. Price Multi- Comment • mm2 cost plier • 386DX 43 $9 $31 3.4 Intense Competition • 486DX2 81 $35 $245 7.0No Competition • PowerPC 601 121 $77 $280 3.6 • DEC Alpha 234 $202 $1231 6.1Recoup R&D? • Pentium 296 $473 $965 2.0 Early in shipments • Assume purchase 10,000 units