Download
1 / 19
190 likes | 306 Views
Chapter 8. Volume Studies & Characteristics. Understand that measured volumes may not be true demands if not careful in data collection and explain the relationships between volume, demand, and capacity Explain typical temporal and spatial variations of volume (from your reading)

E N D
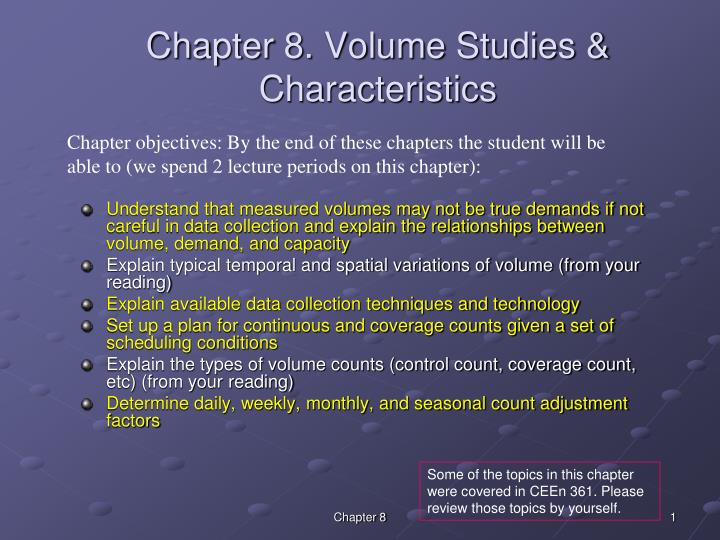
Chapter 8. Volume Studies & Characteristics • Understand that measured volumes may not be true demands if not careful in data collection and explain the relationships between volume, demand, and capacity • Explain typical temporal and spatial variations of volume (from your reading) • Explain available data collection techniques and technology • Set up a plan for continuous and coverage counts given a set of scheduling conditions • Explain the types of volume counts (control count, coverage count, etc) (from your reading) • Determine daily, weekly, monthly, and seasonal count adjustment factors Chapter objectives: By the end of these chapters the student will be able to (we spend 2 lecture periods on this chapter): Some of the topics in this chapter were covered in CEEn 361. Please review those topics by yourself. Chapter 8
8.1 Introduction to traffic studies Purposes Types of studies Volume studies Speed studies Delay studies Density studies Accident studies Parking studies Goods movement and transit studies Pedestrian studies Calibration studies Observance studies • Managing the physical system • Investigating trends over time • Understanding the needs and choices of the public and industry • Calibrating basic relationships or parameters • Assessing the effectiveness of improvements • Assessing potential impacts • Evaluating facility or system performance Chapter 8
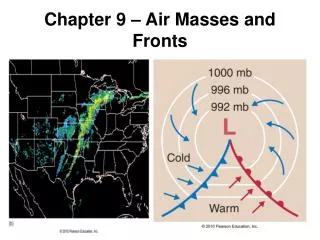
8.2 Volume characteristics Volume: The number of vehicles (or persons) passing the measurement point during a specified time interval. “What is” Rate of flow: The rate at which vehicles (or persons) pass a point during a specified time period less than one hour; expressed as an equivalent hourly rate. Demand: The number of vehicles waiting for service in the given time period, as distinct from the number that can be served. “What motorists would like to be” Capacity: The maximum number that can be expected to be served in the given time period. “What is possible” Upstream bottleneck capacity restrict the flow Depending on the situation, volume may not reflect demand. Chapter 8
Volume vs. demand (cont) May be mistaken as demand When capacity constraints exist upstream, demand cannot be measured downstream, because the discharge volume is NOT demand but bottleneck capacity volume. Chapter 8
Fig 8.3 Effects of a bottleneck on observed volumes 3400x(500/3700) = 459 3400-459=2941 2941x(400/3200) = 368 2941-368=2573 Chapter 8
8.2.2 Volume patterns and characteristics The phenomenon of the peak hour: Do you remember what PHF is? Or 30th highest hourly volume? Chapter 8
Daily, weekly, seasonal variations Chapter 8
8.3 Field Techniques for Volume Studies • Volume counts • Vehicle occupancy • Turning movements at intersections • Vehicle classification 8.3.1 Manual count techniques • Manual counts are still done because for short counts they are still very economical considering that mechanical and electronic counters are not always accurate. • Humans do need some rest between counting intervals for recording and rest; hence count adjustment factors are needed. See Table 8.2 for a simple example. Chapter 8
Manual Count Example Chapter 8
8.3.2 Portable count techniques • Accumulate a total count for the period of the study • Accumulate a total count, recording the total on a daily basis • Accumulate a total count, recording the accumulated total at prescribed intervals To convert the number of (axle) counts to vehicles, the equipment must come with vehicle classification algorithms. Modern ones do have this, although not always accurate. If not, we need to do a classification study, using an automatic counter and manual count. (see next page for an example) Chapter 8
Finding truck adjustment factors This adjustment is needed when we make volume counts by checking the number of axles Manual count result No. of Axles No. of vehicles No. of axles 2 390 780 3 70 210 4 30 120 5 7 35 6 3 18 500 1,163 Total Truck adjustment factor = 1,163/500 =2.33 axles/vehicle Chapter 8
8.4 Intersection Volume Studies 8.4.1 Arrival vs. departure volumes Usually discharge volume is counted at intersections. But when demand > capacity, queue is formed and discharge volume is never greater than the capacity. Hence when adjustments must be made to discharge counts to estimate demand. Counted at the beginning of each red phase at a signalized intersection 8.4.2 Both the counting and the short-break periods must be even multiples of the cycle length when you count at signalized intersections. See the right column of page 179. Chapter 8
8.5 Limited Network Volume Studies Small-network volume studies are intended to determine the amount and pattern of traffic flow over a limited network of street links and intersections during a specified interval. The extent of counting depends on resources -- money and manpower. Usually a sampling technique is used. Two types of counts are needed: Chapter 8
Example of a small-network volume study(pp. 182-186) One-day (8-hr) study: Needs two crews: one at the control count station (8 hrs) and the other at coverage count stations (1 hr at each coverage station). Multi-day (6-day) study: Needs two crews: one at the control count station (8 hr/day, 6 days) and the other at coverage count stations (8 hr at each coverage station). Combined (3-day) study: Needs two crews: one at the control count station (8/hr/day, 3 days) and the other at coverage count stations (4 hr at each coverage station, 2 stations per day). Control count STA Coverage count STA (Review tables 8.5, 8.6, 8.7. – O/H transparencies) Chapter 8
8.6 Statewide Counting Program • Some general principles for statewide programs are: • Objective: Conduct a coverage count every year on every 2-mile segment of the state highway system except low-volume (AADT<100 veh/day) roads. • Objective of coverage counts: Produce an annual estimate of AADT for each coverage location (then VMT) • One control-count location for every 20 to 50 coverage-count locations (stratified highway groups) • Control-count location can be either permanent counts or major or minor control counts. Control count stations count 24 hours 365 days to determine adjustment factors • All coverage counts are for a minimum period of 24-48 hours, eliminating the need to calibrate hourly variation patterns. Chapter 8 (Discuss 8.6.1 and 8.6.2 using tables 8.9 and 8.10.)
8.6.3 Grouping data from control count locations The rule of thumb: Contiguous control-count stations on similar highway types may be grouped if the factors at individual stations for a given day or month do not differ from the average by more than 0.10. (Cluster analysis is a sophisticated grouping technique.) Chapter 8
8.7 Specialized counting studies (covered by CEEn565) OD count is discussed in detail in CEEn 565. Chapter 8
8.7.1 Origin and destination counts (covered by CEEn565) • Conventional traffic origin and destination counts rely primarily on one of the three approaches: • License-place studies • Postcard studies • Interview studies If you have a lot of transponders uses for toll roads, you can automatically collect OD (on-ramp/off-ramp combinations). OD analyses need a lot of iterations. (Discuss the example in Figure 8.19 and Table 8-14.) Chapter 8
8.7.2 Cordon counts (covered by CEEn565) Chapter 8