Download
1 / 65
740 likes | 1.16k Views
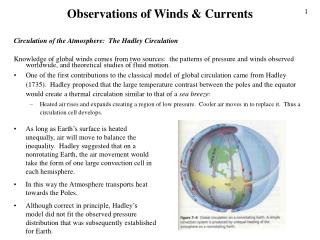
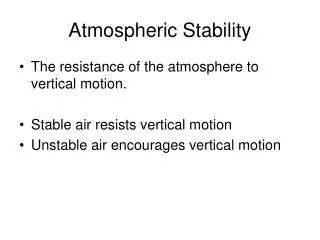
The Atmosphere in Motion: Air Pressure, Forces, & Winds. This chapter discusses: Measurement and meaning of surface and upper-level air pressure Effect of pressure and other forces on surface and upper-level winds. So what sets the wind in motion in the atmosphere?. Atmospheric Pressure.

E N D
The Atmosphere in Motion: Air Pressure, Forces, & Winds • This chapter discusses: • Measurement and meaning of surface and upper-level air pressure • Effect of pressure and other forces on surface and upper-level winds
Atmospheric Pressure • Similar to earth's atmosphere, the pressure at the base of this air column results from the weight of the gases above. • The earth's atmosphere, however, has a greater density of gases at its base due to gravity. • Therefore pressure does not decrease linearly with height. Pressure and density increases with decreasing heights
Temperature & Elevation • When two columns of air are equal in elevation and density, they are at equilibrium. • Adjusting the temperature by cooling (or heating) the entire column will increases (or decreases) the air density. Cooling Heating
While column 2 has a larger depth, the colder, denser column exerts the same amount of force at its base. • Both columns still have the amount of air molecules but column 1 air molecules are confined to a smaller space. • At the surface, equilibrium is maintained, but the taller column has greater upper-level pressure, and winds are generated…how?
Warm air aloft is normally associated with high atmospheric pressure and cold air above is correlated to low atmospheric pressure. • The aloft pressure differences create a force that causes the wind to move from a higher pressure area to a lower pressure region. • The removal of air molecules from column 2 causes the surface pressure from city 2 to fall. • Conversely, over city 1 the pressure rises within the air column due to additional air from column 2. • This force is known as the Pressure Gradient Force (PGF). LSFC HSFC
Pressure Fluctuations • Solar heating of ozone gases in the upper atmosphere, and of water vapor in the lower atmosphere, can trigger oscillating thermal (atmospheric) tides of sea-level pressure change due to absorption. • This atmospheric tide is most noticeable in the tropics (~Δ 2.5 mb). • In the middle latitudes, this tidal effect has a greater pressure fluctuation but the pressure pattern is not as discernable.
Measuring Pressure • Air Pressure can be defined as the force exerted by air molecules over a given area. • We may not feel the constant exertion of the billions of air molecules hitting our body but we can detect rapid changes such as one’s ears popping. • Barometer is an instrument that measures the changes in atmospheric pressure.
Pressure Scale & Units • Many scales are used to record atmospheric pressure, including inches of mercury (Hg) and millibars (mb). • The National Weather Service uses mb to display surface pressure. • Millibars can be converted to metric unit of pressure: hectopascals (hPa). • The conversion is simply 1 hPa = 1 mb. • 100 Pa = 1 mb
Pressure Measurement Mercury Barometer Aneroid Barometer • Changes in atmospheric pressure are detected by a change in elevation of a barometric fluid inside the glass tube or change in diameter of an aneroid cell, which indicates changing weather. • Average sea level pressure is 29.92 in Hg, or 1013.25 mb.
Pressure Trends • Barographs provide a plot of pressure with time, and are useful in weather analysis and forecasting. • Altimeters convert pressure into elevation, and are useful in steep terrain navigation or flying. • Both use aneroid cells.
Pressure Reading & Reporting • Station pressure is the actual pressure observed at the station which accounts for corrected temperature, gravity, instrument error, and elevation of the location. • Increasing the elevation of a station causes a decrease in the column of air above. • To remove the effect of elevation, station pressure is readjusted to sea level pressure adding ~10mb/100m (standardizing all values to sea-level) • Surface isobars show geographic trends in pressure, and are spaced at 4 mb intervals. **Isobars are equal lines of pressure**
Smoothed Isobar Maps • Continental maps of station recorded sea-level pressure are often smoothed and simplified to ease interpretation. • Smoothing adds error to those already introduced by error in instrument accuracy.
Pressure, Temperature, & Density • All 3 of these variables are related through the ideal gas law. • P = ρ Rd T • From this relation, cold air is clearly denser than warm air. (if pressure is held constant) • As temperature increases, the pressure increases. (if density is held constant)
Constant Height Chart • Maps of atmospheric pressure, whether at sea level or above mean sea level (MSL), show variations in pressure at that elevation. • An average isobar at sea-level is about 1000 mb. • An average isobar at 3000 m (MSL) is about 700 mb. • An average isobar at 5600 m (MSL) is about 500 mb.
Constant Pressure (Isobaric) Chart • Maps of constant pressure provide another means for viewing the dynamic atmosphere. • Constant pressure charts show height variations along a constant pressure surface (isobaric). • In this example, there is no variation in elevation for a pressure surface of 500 mb which is located at 5600 m MSL.
Variation in Height • Isobaric (constant pressure) surfaces rise and fall in elevation with changes in air temperature and density. • A low 500 mb height indicates denser air below, and less atmosphere and lower pressure above. • Contour lines indicate rates of pressure change.
Ridges & Troughs • Upper level areas with higher pressure are named ridges, and areas with lower pressure are named troughs. • These elongated changes in the constant pressure maps appear as undulating waves.
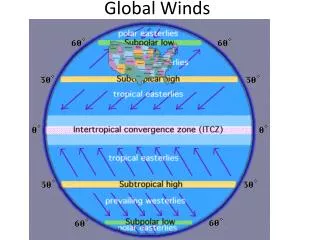
Surface • Surface maps depict pressure contours, highs and lows, and wind direction. • Winds blow clockwise around highs, called anticyclones. • Winds blow counterclockwise around lows, called cyclones (mid-latitude cyclones). • 500 mb maps reveal patterns that on average are 5600 m above the surface, where westerly winds rise and fall across ridges (elongated highs) and troughs (elongated lows). • Height contours of low height values indicate regions of low pressure, while high height values represent areas of high pressure. 500 mb
Newton’s Laws of Motion • First Law • an object at rest will remain at rest and an object in motion will remain in motion (and travel at a constant velocity along a straight line) as long as no force is exerted on the object • Second Law • the force exerted on an object equals its mass times the acceleration produced • Force = mass × acceleration • Third Law • every action has an equal and opposite re-action 1642-1727
Forces & Motion • Air responds similarly as water to this force, moving from higher pressure to lower pressure. • The atmosphere is a fluid. • Pressure force is only one influence on the movement of atmospheric air. • Other forces that determine atmospheric motion are 1)centripetal, 2) friction, and 3) Coriolis [apparent] forces.
Pressure Gradient Force Strong PGF Weak PGF • Change in pressure per change in distance (pressure gradient) determines the magnitude of the pressure gradient force (PGF). • Pressure gradient = Δ pressure / Δ distance • The greater pressure change across a shorter distance, the stronger the PGF. • PGF initiates movement of wind and the stronger the PGF the greater the wind speed. • PGF is the force that drives the wind or causes it to blow.
L Pressure Gradient Force P P + ΔP P + 2ΔP P + 3ΔP Pressure Gradient H Pressure Gradient is directed from low to high values. Pressure Gradient Force is direct from high to low values.
PGF Driven Wind vs. Surface Observed Wind • Pressure gradient force (PGF) winds acting alone would blow directly into low pressure. • Surface observations of winds, such as the cyclonic (counter-clockwise) flow around a low, reveal that PGF winds are deflected by other forces. • Wind speed is greater where the pressure gradients are tighter.
“Apparent” Coriolis Force • Earth's rotation transforms straight line motion into curved motion for an outside viewer. • The Coriolis force explains this apparent curvature of winds to the right due to rotation in the Northern Hemisphere. • Its magnitude increases with wind velocity and earth's latitude.
Actual & Observed Paths • Airplane travel paths have an apparent curvature, just as Coriolis forces affect winds. • Again, the deflection between actual and observed paths is greater near the poles.
North Pole West East Original Destination
North Pole Original Destination New Destination
Right Deflection for the Northern Hemisphere North Pole Apparent Path from the Original Destination Original Destination Actual Path West East New Destination
Original Destination West East South Pole
New Destination Original Destination South Pole
New Destination West East Apparent Path from the Original Destination Original Destination Actual Path South Pole Left Deflection for the Southern Hemisphere
Geostrophic Wind • Winds have direction and magnitude, and can be depicted by vectors. • Observed wind vectors are explained by the act of balancing the pressure gradient and Coriolis forces. • Geostrophic wind is the result between the balance in PGF and Coriolis force. • The geostrophic wind is a conceptual wind and can be calculated instead of taking an observation. • It is usually a good estimate for the observed upper-level wind flow. • These upper level geostrophic winds are parallel to pressure or height contours due to the lack of friction.
Wind Speed & Pressure Contours • Just as a river speeds and slows when its banks narrow and expand, geostrophic winds blowing within pressure contours speed as contour intervals narrow, and slow as contour intervals widen
Isobars & Wind Prediction • Upper level pressure maps, or isobars, enable prediction of upper level wind direction and speed. • These upper-level winds are called geostrophic wind. • PGF = CoF
Centripetal Acceleration & Cyclones • Acceleration is defined by a change in wind direction or speed, and this occurs as winds circle around lows (cyclones) and highs (anticyclones). • Centripetal force is the term for the net force directing wind toward the center of a low, and results from an imbalance between the pressure gradient and Coriolis forces. • Centripetal force =Velocity2 /radius