Download
1 / 1
10 likes | 130 Views
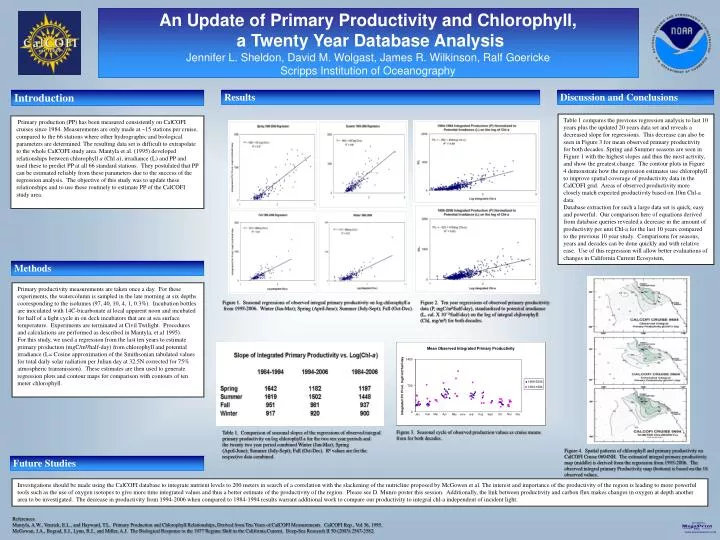
An Update of Primary Productivity and Chlorophyll, a Twenty Year Database Analysis Jennifer L. Sheldon, David M. Wolgast, James R. Wilkinson, Ralf Goericke Scripps Institution of Oceanography. Introduction. Results. Discussion and Conclusions.

E N D
An Update of Primary Productivity and Chlorophyll, a Twenty Year Database Analysis Jennifer L. Sheldon, David M. Wolgast, James R. Wilkinson, Ralf Goericke Scripps Institution of Oceanography Introduction Results Discussion and Conclusions Table 1 compares the previous regression analysis to last 10 years plus the updated 20 years data set and reveals a decreased slope for regressions. This decrease can also be seen in Figure 3 for mean observed primary productivity for both decades. Spring and Summer seasons are seen in Figure 1 with the highest slopes and thus the most activity, and show the greatest change. The contour plots in Figure 4 demonstrate how the regression estimates use chlorophyll to improve spatial coverage of productivity data in the CalCOFI grid. Areas of observed productivity more closely match expected productivity based on 10m Chl-a data. Database extraction for such a large data set is quick, easy and powerful. Our comparison here of equations derived from database queries revealed a decrease in the amount of productivity per unit Chl-a for the last 10 years compared to the previous 10 year study. Comparisons for seasons, years and decades can be done quickly and with relative ease. Use of this regression will allow better evaluations of changes in California Current Ecosystem. Primary production (PP) has been measured consistently on CalCOFI cruises since 1984. Measurements are only made at ~15 stations per cruise, compared to the 66 stations where other hydrographic and biological parameters are determined. The resulting data set is difficult to extrapolate to the whole CalCOFI study area. Mantyla et al. (1995) developed relationships between chlorophyll a (Chl a), irradiance (L) and PP and used these to predict PP at all 66 standard stations. They postulated that PP can be estimated reliably from these parameters due to the success of the regression analysis. The objective of this study was to update these relationships and to use these routinely to estimate PP of the CalCOFI study area. Methods Primary productivity measurements are taken once a day. For these experiments, the watercolumn is sampled in the late morning at six depths cooresponding to the isolumes (97, 40, 10, 4, 1, 0.3%). Incubation bottles are inoculated with 14C-bicarbonate at local apparent noon and incubated for half of a light cycle in on deck incubators that are at sea surface temperature. Experiments are terminated at Civil Twilight. Procedures and calculations are performed as described in Mantyla, et.al 1995). For this study, we used a regression from the last ten years to estimate primary production (mgC/m²/half-day) from chlorophyll and potential irradiance (L= Cosine approximation of the Smithsonian tabulated values for total daily solar radiation per Julian day at 32.5N corrected for 75% atmospheric transmission). These estimates are then used to generate regression plots and contour maps for comparison with contours of ten meter chlorophyll. Figure 1. Seasonal regressions of observed integral primary productivity on log chlorophyll a from 1995-2006. Winter (Jan-Mar); Spring (April-June); Summer (July-Sept); Fall (Oct-Dec). Figure 2. Ten year regressions of observed primary productivity data (P, mgC/m²/half-day), standardized to potential irradiance (L, cal. X 10¯²/half-day) on the log of integral chjlorophyll (Chl, mg/m²) for both decades. Figure 3. Seasonal cycle of observed production values as cruise means from for both decades. Table 1. Comparison of seasonal slopes of the regressions of observed integral primary productivity on log chlorophyll a for the two ten year periods and the twenty two year period combined Winter (Jan-Mar); Spring (April-June); Summer (July-Sept); Fall (Oct-Dec). R² values are for the respective data combined. Figure 4. Spatial patterns of chlorophyll and primary productivity on CalCOFI Cruise 0604NH. The estimated integral primary productivity map (middle) is derived from the regression from 1995-2006. The observed integral primary Productivity map (bottom) is based on the 16 observed values. Future Studies Investigations should be made using the CalCOFI database to integrate nutrient levels to 200 meters in search of a correlation with the slackening of the nutricline proposed by McGowen et al. The interest and importance of the productivity of the region is leading to more powerful tools such as the use of oxygen isotopes to give more time integrated values and thus a better estimate of the productivity of the region. Please see D. Munro poster this session. Additionally, the link between productivity and carbon flux makes changes in oxygen at depth another area to be investigated. The decrease in productivity from 1994-2006 when compared to 1984-1994 results warrant additional work to compare our productivity to integral chl-a independent of incident light. References Mantyla, A.W., Venrick, E.L., and Hayward, T.L. Primary Production and Chlorophyll Relationships, Derived from Ten Years of CalCOFI Measurements. CalCOFI Rep., Vol 36, 1995. McGowan, J.A., Bograd, S.J., Lynn, R.J., and Miller, A.J. The Biological Response to the 1977 Regime Shift in the California Current. Deep-Sea Research II 50 (2003) 2567-2582.