Download
1 / 10
100 likes | 264 Views
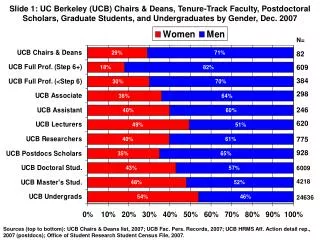
Slide 1: UC Berkeley (UCB) Chairs & Deans, Tenure-Track Faculty, Postdoctoral Scholars, Graduate Students, and Undergraduates by Gender, Dec. 2007. N=. 82. 609. 384. 298. 246. 620. 775. 928. 6009. 4218. 24636.

E N D
Slide 1: UC Berkeley (UCB) Chairs & Deans, Tenure-Track Faculty, Postdoctoral Scholars, Graduate Students, and Undergraduates by Gender, Dec. 2007 N= 82 609 384 298 246 620 775 928 6009 4218 24636 Sources (top to bottom): UCB Chairs & Deans list, 2007; UCB Fac. Pers. Records, 2007; UCB HRMS Aff. Action detail rep., 2007 (postdocs); Office of Student Research Student Census File, 2007.
Slide 2: UCB Faculty Social Sciences* by Rank, Gender, and Ethnicity, Dec. 2007 N= 14 93 70 68 57 5827 10894 *Social Science includes Division of Social Sciences and International Areas Studies. **URM=Individuals of African, Hispanic, or American Indian or Alaskan native origins. ***Chair/Dean figures are broken down only by gender because of low counts. ****Source: UCB Faculty Applicant Pool Database, 2001-2007. Not all departments have responded. *****Based on PhDs granted to U.S. Residents, 2000-2004, at the 50 Institutions producing the most PhDs at Top Quartile Rated doctoral programs (National Research Council Reputation Ratings), Survey of Earned Doctorates. Faculty Headcount Source: UCB Faculty Pers. Rec. 2007.
Slide 3: UCB Faculty Headcount by Gender, 1979-2007 Source: UCB Faculty Personnel Records, 1979-2007.
Slide 4: UCB Undergraduate Admit/Applicant Ratio by Gender*Freshman Applicants, 1983-2007 Prop 209 Goes into Effect *Includes Calif. residents & non-residents. Source: UCB Office of Student Research (OSR), Undergraduate Applicant Files, 1983-2007.
Slide 5: Achieving Tenure at UCB by Gender and STEM*/Non-STEM (Includes All Current and Former UCB Faculty with Assistant Start Dates July 1985-2007) *Includes Physical/Biological Sciences, Math., & Technology. Total N= Wom.-STEM, 86 to 45; Men-STEM., 315 to 178; Wom.-Non.-STEM , 229 to 119; Men.-Non.-STEM, 292 to 163. Source: UCB Faculty Personnel Records, 1985-2007
Slide 6: Advancing through the Ranks (mean age/time) : UCB Faculty by Gender* *All segments of bars represent 15+ individuals. **Phys. Sc., Technology, Engineer., & Math. Source: UCB Faculty Personnel Records, 1980-2007.
Slide 7: Significant Differences* in the % of UCB Faculty in the Sciences Satisfied** with Various Elements of Their Position, by Gender *Yellow shading denotes that gender differences are significant (p<.05) when controlling for rank and sub-groups in the sciences. **Includes very satisfied and somewhat satisfied vs. somewhat dissatisfied and very dissatisfied. Note: Other elements of satisfaction surveyed included: current rank, current salary, advising respons., quantity/quality of research space, res. and library fac., computer fac., $ for new ventures, number & quality of grad. students, opp. to collaborate w. faculty, intellectual stimulation, clerical/admin. supp., parking, housing, & commute time. ***Phys. Sc., Technology, Engineer., & Math. Source: UCB Faculty Climate Survey, 2003. Total N, Women=109+, Men=383+
Slide 8: % of UCB Faculty Citing Selected Job Factors* as Weighing Heavily in Their Decision to Stay or Leave UCB, by Gender & Race/Ethnicity *Prior to any counteroffer by UCB. Faculty could choose up to 5 different factors. **Individuals of African, Hispanic, or American Indian origins. Green shading=sig. diff. at .10 level from ref. group (male or white). Yellow shading indicates significant difference at .05 level. Blue shading indicates significant difference at .01 level. Source: UCB Faculty Retention Survey, 2007.
Slide 9: The Baby Lag for Univ. of Calif. (UC) Women Faculty in Pursuit of Tenure Hire Date Hire Date Years Before Hire Date Years After Hire Date N=2340 Men 982 Women *Year 0 represents Assistant Professor Hire Date Source: Mason, Mary Ann, Angelica Stacy, and Marc Goulden. 2003. “The UC Faculty Work and Family Survey.” (http://ucfamilyedge.berkeley.edu).
Slide 10: Methods Used by UCB Departments to Enhance/Diversify Faculty Pool Note: Yellow shading denotes p<.05 significant difference based on chi-square. *Please Note: Departmental self-evaluation of success was highly correlated with our independent analysis of actual success. Note: Light Green shading denotes p<.10 significant difference based on chi-square. Source: UCB Departmental Faculty Recruitment Survey, 2005.


![70-246 Exam Dumps - Pass with 70-246 Dumps PDF [2018]](https://cdn4.slideserve.com/7925339/microsoft-70-246-exam-microsoft-private-cloud-dt.jpg)

![[Updated] Microsoft 70-246 Dumps - Microsoft MCSE 70-246 Dumps PDF](https://cdn4.slideserve.com/8077603/microsoft-dt.jpg)