Download
1 / 25
250 likes | 364 Views
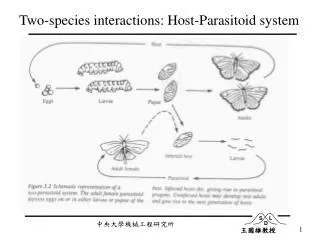
Modelling Two Host Strains with an Indirectly Transmitted Pathogen. Angela Giafis 20 th April 2005. Motivation. Disease can be spread by contact with infectious materials (free stages) in the environment.

E N D
Modelling Two Host Strains with an Indirectly Transmitted Pathogen Angela Giafis 20th April 2005
Motivation • Disease can be spread by contact with infectious materials (free stages) in the environment. • Interested in what happens when 2 different host types, one more susceptible to infection the other more resistant, are subjected to such an infection.
Structure • Discuss the differences between two models. • Equilibrium solutions, feasibility and stability. • Show parameter plots. • Look at some dynamical illustrations.
Models Model 1: Model 2:
Both models have demography (births and deaths) and infection but as we see there are details that differ and this turns out to matter. Much of the behaviour of model 1 is governed by the term D0 which is the basic depression ratio, where
Total extinction (0,0,0,0,0,0) Uninfected coexistence (S1*,0,0,K-S1*,0,0) with S1*є [0,K] Strain 1 alone with the pathogen (Ŝ1,Î1,Ŵ1,0,0,0) Strain 2 alone with the pathogen (0,0,0,Ŝ2,Î2,Ŵ2) Feasible Feasible Feasible if K > HT,1 Feasible if K > HT,2 Equilibrium Solutions and Feasibility: Model 1
Total extinction (0,0,0,0) Strain 1 alone at its carrying capacity (K1,0,0,0) Strain 2 alone at its carrying capacity (0,K2,0,0) Strain 1 alone with the pathogen (Ŝ1,0,Î1,Ŵ1) Strain 2 alone with the pathogen (0,Ŝ2,Î2,Ŵ2) Coexistence of the strains and the pathogen (S1*,S2*,I*,W*) Feasible Feasible Feasible Feasible if K1 > HT,1 Feasible if K2 > HT,2 Feasible if q1υ2-q2υ1 < 0 and HT,1<K12<HT,2 Equilibrium Solutions and Feasibility: Model 2
Stability: Model 1 • (0,0,0,0,0,0) is unstable • (S1*,0,0,K-S1*,0,0) is neutrally stable iff (K-S1*)/HT,2+S1*/HT,1<1 and given feasibility. For point stability we need ABC-C2-A2D>0, if ABC-C2-A2D<0 we expect limit cycles. • (Ŝ1,Î1,Ŵ1,0,0,0) is stable iff D0,1<D0,2 and given feasibility. For point stability we need A1B1-C1>0, if A1B1-C1<0 we expect limit cycles. • (0,0,0,Ŝ2,Î2,Ŵ2) is stable iff D0,2<D0,1 and given feasibility. For point stability we need A2B2-C2>0, if A2B2-C2<0 we expect limit cycles.
Stability: Model 2 • (0,0,0,0) is unstable • (K1,0,0,0) is stable iff K1<HT,1 • (0,K2,0,0) is unstable • (Ŝ1,0,Î1,Ŵ1) is stable iff HT,1>K12 and given feasibility. For point stability we need A1B1-C1>0, if A1B1-C1<0 we expect limit cycles. • (0,Ŝ2,Î2,Ŵ2) is stable iff K12>HT,2 and given feasibility. For point stability we need A2B2-C2>0, if A2B2-C2<0 we expect limit cycles. • (S1*,S2*,I*,W*) is stable given feasibility. For point stability we need ABC-C2-A2D>0, if ABC-C2-A2D<0 we expect limit cycles.
Parameter Plots • Trade-off : individual hosts pay for their increased resistance to the pathogen by a reduction in the contribution to the overall fitness. • Our parameter plots are representative of our stability conditions. • The susceptible strain (strain 1) values are fixed and we will vary two of the resistant strain (strain 2) parameters.
Dynamical Illustrations: Model 1B Region A Region B
Region D Region C Region D
Region F Region E Region F Region F
Region B Region A Region C
Region D Region D
Dynamical Illustrations 2B Region B Region A
Region C Region C
Region B Region A Region B
Region C Region C
Summary • In both models we considered two cases, one where the more susceptible strain is point stable (A1B1-C1>0) and one where we expect to see limit cycles (A1B1-C1<0). • Model 1: coexistence not possible. • Model 2: coexistence possible. Indeed cyclic coexistence of all the populations is possible. • Outcome depends on balance between costs and benefits.
Future Work • n-strain models. • Investigating cycles.