Download
1 / 13
130 likes | 258 Views
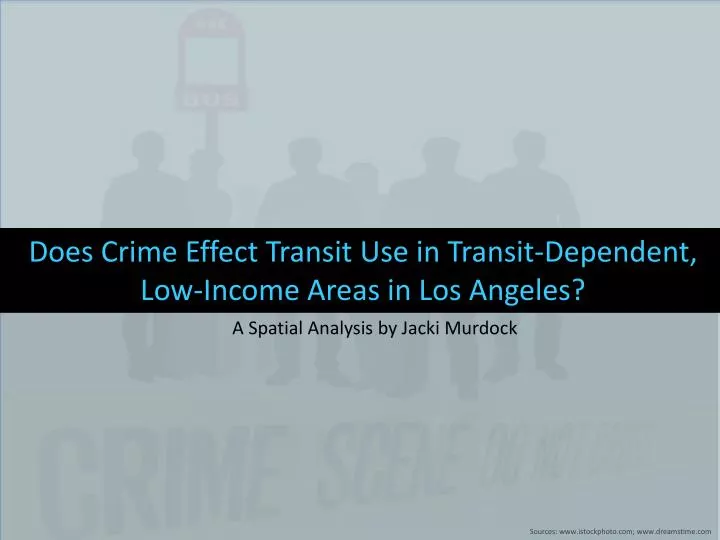
Does Crime Effect Transit Use in Transit-Dependent, Low-Income Areas in Los Angeles?. A Spatial Analysis by Jacki Murdock . Sources: www.istockphoto.com; www.dreamstime.com. How do crime rates effect transit use in low-income, transit-dependent and dense areas within Los Angeles?

E N D
Does Crime Effect Transit Use in Transit-Dependent, Low-Income Areas in Los Angeles? A Spatial Analysis by Jacki Murdock Sources: www.istockphoto.com; www.dreamstime.com
How do crime rates effect transit use in low-income, transit-dependent and dense areas within Los Angeles? • So, when there is more crime around a transit transit, do riders choose to go to another transit stop further away from the crime? • Data: METRO bus ridership data for every month (September 2011-January 2012) and LAPD crime data for those months. The Question
Process of Site Selection Process 1 Process 2 Process 3
Weighted Variable equation= (0.4*Transit Use)+(0.4*Low-Income)+(0.2*Density) These three variables were weighted with 40% on transit use, 40% on low-income and 20% on density. I then chose to focus only on the census tracts with the highest combined rates of these variables. Final Site Selection
Process: • 300 Meter buffer around the center of each tract. • Summed the ridership data at each stop within the buffer. • 600 Meter buffer around the centroid of each tract. • Summed the occurrences of crime in the buffer. • Ran an OLS regression: 0.4% of the change in bus ridership is explained by crime. Sept 2011 Oct 2011 Nov 2011 Dec 2011 Jan 2012
0.5% of the change in bus ridership is explained by crime in October. Sept 2011 Oct 2011 Nov 2011 Dec 2011 Jan 2012
0.02% of the change in bus ridership is explained by crime in November. Sept 2011 Oct 2011 Nov 2011 Dec 2011 Jan 2012
0.7% of the change in bus ridership is explained by crime in December. Sept 2011 Oct 2011 Nov 2011 Dec 2011 Jan 2012
0.2% of the change in bus ridership is explained by crime in January. Sept 2011 Oct 2011 Nov 2011 Dec 2011 Jan 2012
There could be a delay in reacting to increased or decreased ridership-so that October’s crime effects September’s ridership. • Include other factors in the physical environment, such as the presence of alley ways, lighting, etc. that could effect both crime rates and transit use. • Compare low-income, high-crime areas with high-income, low-crime areas and see if the latter is more sensitive to fluctuations in crime than are the more transit dependent areas. Possible Explanations: Moving Forward
Inset Map • Graduated Symbols • Aggregating Attribute Fields • Creating Indices • Attribute sub-set selections • Geographic sub-set selections • Buffering • Geoprocessing • Geocoding • Charts Skills Used