Download
1 / 25
480 likes | 1.03k Views
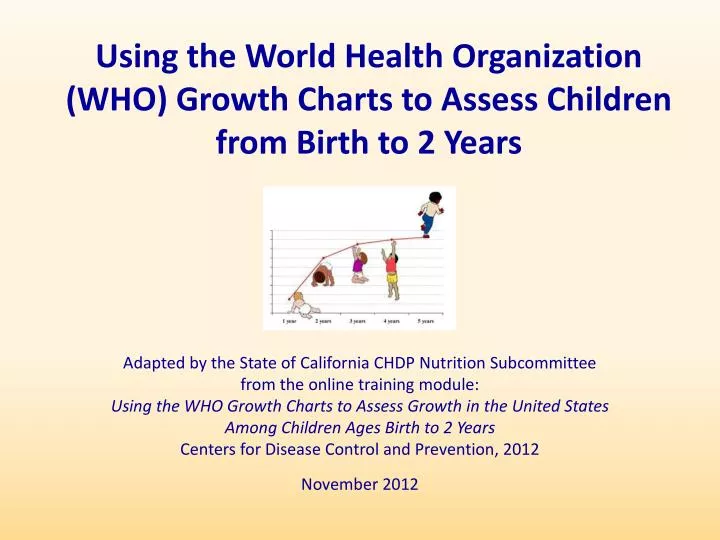
Using the World Health Organization (WHO) Growth Charts to Assess Children from Birth to 2 Years. Adapted by the State of California CHDP Nutrition Subcommittee from the online training module: Using the WHO Growth Charts to Assess Growth in the United States

E N D
Using the World Health Organization (WHO) Growth Charts to Assess Children from Birth to 2 Years Adapted by the State of California CHDP Nutrition Subcommittee from the online training module: Using the WHO Growth Charts to Assess Growth in the United States Among Children Ages Birth to 2 Years Centers for Disease Control and Prevention, 2012 November 2012
Objectives By the end of this presentation, you will be able to: • Describe the new WHO growth chart • Understand differences between WHO and CDC growth charts for infants and children 0-2 years • Plot on the appropriate growth chart • Interpret results and make referrals when appropriate
Growth Chart Recommendations for Health Care Providers CDC recommends that health care providers: • Use the WHO growth chartsfor infants and children 0 to 2 years of age • Use the CDC growth chartsfor children ages 2 to 20 years CHDP requires transition to theWHO growth charts by October 2013
WHO Growth Chartsfor Infants and Children Birth to 24 Months • Child growth is monitored to: • Assess adequacy of nutrition • Identify weight status and potential for obesity • Screen for disease related to abnormal growth • Growth charts arethe standard toolfor interpreting growth
Compare the WHO Growth Standards and the CDC Growth Reference
Benefits of Using WHO Growth Charts • Based on high quality population data • Growth charts align with AAP and WIC growth assessment tools and feeding recommendations • Supports breastfeeding as optimal nourishment • Allows provider to address feeding practices and family environment
Impact of WHO Growth Charts on the Interpretation of Growth Mode of feeding can influence infant growth rate
Growth Rate for Breastfed Infant Breastfed infantsgrow fasterin the first 3 months Breastfed infants grow slower from3 to 12 months Girls: Birth to 24 months Weight-for-age curves Adapted from Figure 2. Use of World Health Organization and CDC Growth Charts for Children Aged 0--59 Months in the United States. CDC Morbidity and Mortality Weekly Report (MMWR) Recommendations and Reports 2010; 59(rr09):1-15. Available online at: http://www.cdc.gov/mmwr/preview/mmwrhtml/rr5909a1.htm
WHO Growth Charts Are Different • Fewer infants are below 5th percentile on Weight-for-age charts • Fewer infants are above 95th percentile on Weight-for-length charts • Fewer infants are below 5th percentile on Weight-for-length charts • A similar number of infants are below 5th percentile on Length-for-age charts
Compare the WHO and CDC Growth Prevalence Rates by Age Low length-for-age* Low weight-for-age* High weight-for-length†
Recommended Cutoffs WHO Growth Charts - Birth to 24 months > 98 % High weight-for-length < 2 % Low weight-for-length 2 - 98 % Healthy weight 2 5 10 25 50 75 90 95 98
Recommended BMI-for-Age Cutoffs CDC Growth Charts - 2 to 20 Years < 5 % Underweight 85 - < 95 % Overweight ≥ 95 % Obese 5 - < 85 % Healthy Weight 5 10 25 50 75 85 95 Use terms “overweight” and “obese” only for children and teens between 2 and 20 that fall in the corresponding %ile ranges
WHO Growth StandardsBirth to 24 Months • Growth Parameters • Weight-for-age • Length-for-age • Weight-for-length • Head circumference-for-age • No BMI percentile because this is not a measure used for children younger than 2
Boys: Birth to 24 months Head circumference-for-age Weight-for-length Length-for-age Weight-for-age
Girls: Birth to 24 months Head circumference-for-age Weight-for-length Length-for-age Weight-for-age
Incorporating the WHO Growth Charts Into Your Practice • CHDP requires that enrolled providers transitionto WHO growth charts by October 2013 • Review growth at each health assessment and interpret carefully • Understand that an infant will plot differently on the WHO growth chart than on the CDC chart • Encourage breastfeeding • Review feeding with each health assessment and determine if foods are developmentally appropriate
When Growth Deviatesfrom the Norm • Check accuracy of your measurements • Note that individual growth may not follow a smooth curve • Recognize limitations of a single growth percentile value • Obtain serial measurements over time • If weight-for-length is < 2nd % or > 98 %,assess fully, follow closely and refer, if needed
Case ExampleGraph George’s Growth George is an 18-month-old boy. George's mother, Rae, works outside the home. George is cared for by his grandmother during the day when Rae is working. George has been formula-fed since birth, and he was around 5 months of age when he began eating solid foods. George has been seen by his health care provider regularly since birth, and his weight and length have been recorded and plotted on the growth chart at each visit.
Graph George’s Growth CDC Weight-for-Age Growth Chart WHO Weight-for-Age Growth Chart George George
Comparing Weight-for-Length George George CDC Weight-for-Length Growth Chart WHO Weight-for-Length Growth Chart
Moving from WHO to CDC Chartsat 2 Years • Recumbent length to standing height measurements (difference is approximately 0.8 cm or ¼ inch) • Optimally fed study population to a reference population using the general pediatric population • WHO weight-for-length to CDC BMI-for-age percentile • 5th - 95th cutoff values to 2nd - 98th cutoff values
Possible Changesfor an Individual Child at Age 2 • Length-for-age percentile may be similar • CDC weight-for-age may be lower • CDC BMI-for-age percentile may be lower than WHO weight-for-length
How to Get Started • Develop protocol for weighing and measuring • Select appropriate charts for age and gender • Record and plot on growth charts • Interpret growth indicators • Counsel on growth and feeding • Support breastfeeding
References • WHO Growth Chart Trainings http://www.cdc.gov/nccdphp/dnpao/growthcharts/who/index.htm http://www.who.int/childgrowth/training/en/ • CDC Morbidity and Mortality Weekly Report (MMWR) Recommendations and Reports http://www.cdc.gov/mmwr/preview/mmwrhtml/rr5909a1.htm • WHO Growth Charts http://www.cdc.gov/growthcharts/who_charts.htm • AAP Policy Statement:Breastfeeding and the Use of Human Milk http://www2.aap.org/breastfeeding/files/pdf/Breastfeeding2012ExecSum.pdf
Training and Education Tools • CHDP Training Modules • How to Accurately Weight and Measure Children • Using Body Mass Index-for-Age Growth Charts • Counseling the Overweight Child • Promoting Physical Activity • Glucose and Cholesterol Screening http://www.dhcs.ca.gov/services/chdp/Pages/Training.aspx • Breastfeeding materials http://www.nal.usda.gov/wicworks/Sharing_Center/gallery/family.html http://wicworks.nal.usda.gov/breastfeeding http://www.cdph.ca.gov/programs/wicworks/Pages/WICBreastfeeding.aspx • Women, Infants and Children Program (WIC)http://www.cdph.ca.gov/programs/wicworks/Pages/default.aspxSlides 11 and 12 of this presentation were adapted from the WIC WHO Growth Charts In-Service Training: http://www.cdph.ca.gov/programs/wicworks/Pages/WorldHealthOrganization(WHO)GrowthCharts.aspx