Download
1 / 10
100 likes | 225 Views
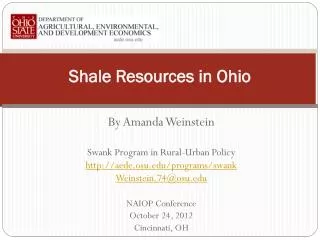
The Economic Value of Shale Natural Gas in Ohio. By Amanda Weinstein and Mark Partridge Swank Program in Rural-Urban Policy http://aede.osu.edu/programs/swank Weinstein.74@osu.edu Presented at the Leadership Cincinnati/Cincinnati Chamber of Commerce

E N D
The Economic Value of Shale Natural Gas in Ohio By Amanda Weinstein and Mark Partridge Swank Program in Rural-Urban Policy http://aede.osu.edu/programs/swank Weinstein.74@osu.edu Presented at the Leadership Cincinnati/Cincinnati Chamber of Commerce For a Sustainable Future: Shale Gas Panel May 3, 2012 Cincinnati, OH
The Importance of Realistic Expectations • We are concerned that job numbers may be overinflated by an industry. • In an earlier policy brief, we had similar concerns about the hype surrounding green jobs. • Subsequent reports, including a recent Wall Street Journal article, verified that these employment expectations were overly optimistic: • Expecting big numbers for green jobs, small businesses expanded only to find themselves in bankruptcy when job numbers lower than expected. • Commenting on shale energy development, Aubrey McClendon CEO of Chesapeake Energy of Oklahoma was quoted in the Columbus Dispatch saying, “This will be the biggest thing in the state of Ohio since the plow.”
The Economic Impact • We can draw upon the experiences and lessons learned from other states like Pennsylvania to create counterfactuals. • Compare drilling counties with similar non-drilling counties in PA. • Statistical regressions on the entire state of PA • Trends in direct oil and gas employment • The income effect was positive and significant (lease/royalty payments and bid-up wages), but the employment effects were modest (even in rural counties). • Examining the trends in employment we find the jobs impact of shale development will be approximately 20,000 after accounting for the multiplier effect.
Why the Difference? • Our estimate is lower than industry-funded estimates that range from more than 65,000 to over 200,000. • ‘Impact studies’ that estimate direct and indirect effects are over-estimates of new job creation and serious regional economists have not viewed them as best practice for decades. • At best, a well done impact study should tell you how many jobs are ‘supported’ by an industry, not how many jobs it ‘created.’ • At worst, the economic effects can be double counted and unrealistic assumptions applied to the model to increase estimates. • NOT COUNTERFACTUALS!
Displacement Effects • The modest job impacts are not surprising • Displacement effects and effects on other industries (‘Dutch Disease’) reduce the employment effects • The effect on the coal industry and tourism • The impact of bid up wages on industries that rely on low wages “Among the inconveniences the boom has caused for locals -- including a higher cost of living, more traffic and higher turnover rates among businesses that lose employees to the oilfields-- there's a huge housing shortage.” (CNN Money, 2011) Sign in front of Taco John’s in North Dakota
A Small Share of Total Employment • “The 36,000 jobs specifically created to drill for oil and gas [in 2011]… came in well below direct hiring in other industries.” (CNN Money, April 25, 2012) • The construction industry created 69,000 in 2011 Even with impressive growth rates, the energy sector is still a small share of the total Ohio economy at 5.35 million in Feb. 2012 (U.S. BLS) Ohio and Pennsylvania Direct Oil and Gas Employment
Economic Theory • The energy industry is more capital intensive than labor intensive • Economists have 150 years of evidence on natural resource booms and the evidence is often negative. • There are more examples of underperforming (Venezuela, WV) than over performing energy economies (Norway) • Studies have shown that countries are actually hindered and not helped by their resource abundance - ‘the natural resource curse’ • A similar trend has been shown for U.S. states and counties
Conclusions • Shale natural gas is associated with significant income effects but modest employment effects. • However, the real question of shale investment is not job creation, but net benefits vs. costs including environmental costs. • In this question, natural gas should be compared to coal, the true alternative. • Shale natural gas is lower cost, less carbon, and like coal has local pollution impacts. • Ohio should consider higher severance tax to counteract some of these costs and pay for long-term benefits. • Schools, infrastructure, environment.
Thank You Amanda Weinstein Research Associate for the Swank Program in Rural-Urban Policy Dept. Agricultural, Environmental & Development Economics The Ohio State University (weinstein.74@osu.edu)