Download
1 / 6
70 likes | 194 Views
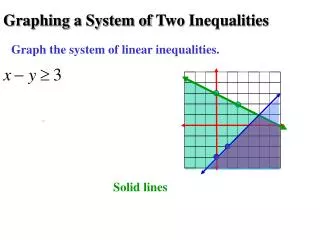
Graphing a System of Inequalities. System of Inequalities. The Solution region is where the shadings overlap. For instance the following point is in the solution region because it satisfies both inequalities:. 0 ≤ 5. True. (0,0). 0 > -1. True.

E N D
System of Inequalities The Solution region is where the shadings overlap. For instance the following point is in the solution region because it satisfies both inequalities: 0 ≤ 5 True (0,0) 0 > -1 True Points are solutions to this system if they make both inequalities true.
System of Inequalities Graph the solution region of the system of inequalities. Plot each inequality individually. Find out which side to shade for each inequality. (0,0) (0,1) 0 ≥ 1 1 < 0 False False Find where the shadings overlap.
System of Inequalities Graph the solution region of the system of inequalities. Plot each inequality individually. Find out which side to shade for each inequality. (0,0) (0,0) 0 < 3 0 ≤ 4 True True Find where the shadings overlap.
System of Inequalities Graph the solution region of the system of inequalities. Plot each inequality individually. Find out which side to shade for each inequality. (0,0) (0,0) 0 ≤ 4 0 ≥ 4 True False Find where the shadings overlap.
System of Inequalities Graph the solution region of the system of inequalities. Plot each inequality individually. Find out which side to shade for each inequality. (0,0) (0,1) 0 ≥ 3 1 ≤ 0 NO SOLUTION False False Find where the shadings overlap.