Download
1 / 39
390 likes | 476 Views
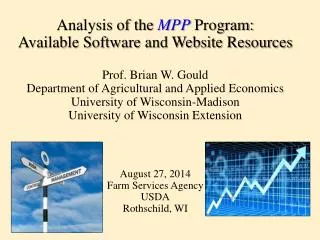
Dairy Marketing. Dr. Roger Ginder Econ 338 Fall 2009 Lecture # 7. Price $/#. Supply. P 1. P o. Q 1. Q o. Quantity # of milk. Relatively Inelastic Supply. Price $/#. Supply. P 1. P o. Quantity # of milk. Q o. Q 1. Relatively Elastic Supply. Shifts in the Supply Curve.

E N D
Dairy Marketing Dr. Roger Ginder Econ 338 Fall 2009 Lecture # 7
Price $/# Supply P1 Po Q1 Qo Quantity # of milk Relatively Inelastic Supply
Price $/# Supply P1 Po Quantity # of milk Qo Q1 Relatively Elastic Supply
Shifts in the Supply Curve If we relax the assumption that all else is equal the supply curve can shift For example assume that the cost of feed to all producers increases Producers will reduce the amount of milk they are willing to produce for any given price The supply curve will shift upward and to the left
Price S1 So P1 Po Do Quantity Q1 Qo Factors that can shift supply: 1. New technology 2. Changes in input costs 3. Raw material or resource availability 4. Legal or government program constraints on production
DEMAND • MAJOR PRODUCTS • PER CAPITA CONSUMPTION • PRODUCTION REGIONS
U.S. Milk Utilization Source: Agricultural Statistics, NASS, USDA
Total U.S. Milk Production and Total Commercial Disappearance, 1980-2008 Sources: Agricultural Statistics, NASS, USDA & Livestock, Dairy & Poultry, ERS, USDA
Total U.S. Milk Supply Source: Agricultural Statistics, NASS, USDA
Total Manufactured Dairy Products, U.S. Source: Agricultural Statistics, NASS, USDA
Total Milk Available for Fluid Products, U.S. Source: Agricultural Statistics, NASS, USDA
GENERAL MILK FLOWS DIAGRAM • Path Milk Travels in the Dairy Market Channel • Types of Firms Involved in Marketing Milk • Major Institutions that Impact How Milk is Marketed
GENERAL MILK FLOWS DIAGRAM Producer 85%-90%? Coop Handler
GENERAL MILK FLOWS DIAGRAM Producer 10%-15%? 85%-90%? Coop Handler Independent Processor
GENERAL MILK FLOWS DIAGRAM Producer 10%-15%? 85%-90%? Coop Handler Coop Processor Independent Processor
GENERAL MILK FLOWS DIAGRAM Producer 10%-15%? 85%-90%? Coop Handler Coop Processor Governed by FMMO if Grade A Independent Processor
GENERAL MILK FLOWS DIAGRAM Producer 10%-15%? 85%-90%? Coop Handler Coop Processor Governed by FMMO if Grade A Independent Processor Various types of market outlets Various types of market outlets
GENERAL MILK FLOWS DIAGRAM Producer 10%-15%? 85%-90%? Coop Handler Coop Processor Governed by FMMO if Grade A Independent Processor Various types of market outlets Various types of market outlets Final consumers Final consumers
GENERAL MILK FLOWS DIAGRAM Producer 10%-15%? 85%-90%? Coop Handler Coop Processor Governed by FMMO if Grade A Independent Processor Various types of market outlets Various types of market outlets Government Government Final consumers Final consumers
The Milk Flow Diagram Oversimplifies A Very Complex System • Numerous Manufacturing Processes • Numerous Products • Numerous Distribution Channels
MARKET OUTLETS FOR PROCESSED MILK • Traditional Supermarket and Convenience-store retailers • Food service and restaurants • Ingredients to food manufacturers • Mass market retailers • Health food stores • Animal feed • Industrial users
SUPERMARKETS & C-STORES (Products) • Fluid products (Class I) • Extended Shelf Life (ESL) fluid product • Cheeses • Class II products • NMP based products • Specialty products (eg. Frappuccino) • Diet beverages (Slim Fast)
Grocery Consolidation Late 1990’s Grocery Acquisition, Expansion & Format Variations • Fred Meyer, Smith’s, QFC & Hughes • Ralph’s & Food 4 Less • Albertson’s: Buttrey, Smitty’s, Seessel’s + Brunos • American Stores: Jewel, Ames, Lucky • Von’s, Dominicks, Randalls • Bi-Lo, Tops, Stop & Shop, Edwards, Finast, Giant, Giant & U.S. Foodservice, Peapod (Online Grocery) • Wetterau, Richfoods • Scrivner • Kash N’ Karry, Hannaford • Star Markets • Kroger • Albertson’s • Safeway • Ahold • Super Value • Fleming • Food Lion • Shaws/Sainsbury
Top Grocery Firms by 1999 Sources: Wall Street Journal, 8/4/98 Customer Estimates, 1998 Marketing Guidebook, SuperMarket News, 6/14/99.
Changing Market Environment: Top Retail Food Companies *Wal-Mart includes supercenters and Sam’s Club wholesale outlets Source: Supermarket News, 2001
Dramatic Change in the Supermarket Sector During the Past Decade • Rise of the Walmart “Super Center”&Club • Rapid Merger of Supermarket Chains in the Late 1990’s • Concentration of Buying Power in Supermarkets • Consolidation of the Regional Class I and II Dairy Processing Firms • Concentration of Class III & IV Processors
FOOD SERVICE (Products) • Bulk fluid • Cheeses • Bulk Class II • Individual serving package • Specialty products • NMP/WMP/BMP • ESL fluid products
FOOD SERVICE CATEGORY SEGMENTS Approximate Segments $ Vol. Bil Percent Restaurants & Bars 75 bil 51% Fast food Full service Cafeteria/Buffet Bars Retail hosts 12 9% Travel leisure 10 7% Business institute 12 8% Education institute 10 7% Health care/service 6 4% All other 15 10% $140 bil
LONG TERM TRENDS IN FOOD SERVICE INDUSTRY • Consolidation of large number fragmented firms • Development of low cost supply chains • Partnering with low labor cost manufacturers with unique products to meet needs • Food safety important • Manufacturer assurance about production (e.g., GMO, Growth Hormones, Micro Organisms) • Product safety • Product wholesomeness
MASS MARKET RETAILERS • Diet beverages (Slim Fast) • Evaporated milk • NMP based products • Dried cheeses • Aseptic packaged milk
INGREDIENTS TO FOOD MANUFACTUERS (Products) • Cheeses (including dried, sauces, extracts) • Whey powder/Whey fractions • NMP/WMP/BMP • Buttermilk (fluid) • Class II products • Fluid milk • Casein • Butter/Butter Oil
HEALTH FOOD STORES • Protein supplements • Mineral supplements • Other specialty products
INDUSTRIAL USERS/FEED USERS • Glue and adhesives • Chemical proteins • Calf milk replacers • Starter feeds
Fluid Milk & Cheese Consumption • Two General Product Categories Account for the Majority of Per Capita Milk Consumed • Fluid Milk and Cream Account for About 205 lbs. Per Capita • Cheeses Account for About 310 lbs. Per Capita • Butter, NMP, Ice Cream, Condensed and Evaporated Milk, Account for Most of the Remainder of Per Capita Milk Consumption
U.S. Per Capita Consumption of Fluid Milk & Cream Source: Agricultural Statistics, NASS, USDA