Download
1 / 49
510 likes | 648 Views
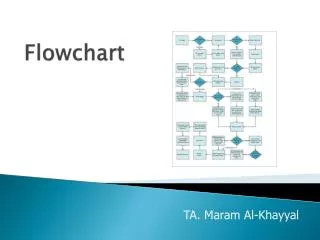
Code Visual to Flowchart. Basem AL-yasouri 200820364 Ayad R Meshalmeha 200920110 Fadi Alalean 200720475 Loay abu odah.

E N D
Code Visual to Flowchart Basem AL-yasouri 200820364 Ayad R Meshalmeha 200920110 Fadi Alalean 200720475 Loay abu odah
Code Visual to Flowchart is a code maintain and understand software that is capable to rapidly analyze source code and to display in the flowchart window the graphical presentation of currently edited code. Code Visual to Flowchart is composed of a code editor and a flowchart Window .The flowchart engine is so fast that the flowchart can be constantly displayed as the alternative view of the currently edited source code. You can export flowchart of current edited code as Bitmap on any flowchart expand level you like ,Help you to create code flowchart document easily. Introduction
Code Visual to Flowchart supports all primary program languages,such as C ,C++ ,Java ,JavaScript ,VB ,BASIC ,Qbasic ,ASP ,Vbscript ,Delphi ,Pascal ,PHP ,C#,VB.NET ,Perl... Code Visual to Flowchart is composed of a code editor and a flowChart window . • In the various implementations of flow charts, they are usually displayed in a way that all the source code is partitioned in fragments and displayed inside the drawn blocks. • Code Visual to Flowchart is based on different philosophy . The Flow Chart engine is so fast that the Flow Chart can be constantly displayed as the alternative view of the currently edited source code. • Code Visual to Flowchart does not display code in flow charts. Since flow charts can always be synchronized with Editor, it is enough to display the code structure from the source inside of the flow chart. The real code can always be edited in its natural way - inside of the Editor window.
Another strategy with which Code Visual to Flowchart fights against enormously large flow charts is the concept of expand levels. The maximum depth of displaying the enclosed blocks can always be specified and easily changed.Code Visual to Flowchart features the quickest navigation of source code and it is also a good assistant when you are working on a program IDE .
Goals is to understand these following :- What is flowchart ?? Why we will use flow chart & when!! ?? Get Know to the environment of Code Visual to Flowchart. How can you work in these tool Benefits of code visual to flowchart Make your own flowchart from your own code ^_^. Tutuila's.
START END Display message “How many hours did you work?” Display message “How much do you get paid per hour?” Read Hours Read Pay Rate Multiply Hours by Pay Rate. Store result in Gross Pay. Display Gross Pay What is a Flowchart? • A flowchart is a diagram that depicts(“yosor”) the “flow” of a program. • The figure shown here is a flowchart for the pay-calculating program in Chapter 1.
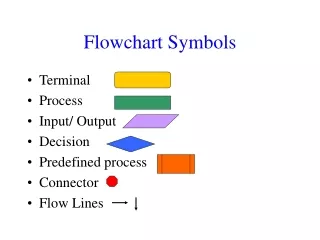
START END Display message “How many hours did you work?” Display message “How much do you get paid per hour?” Read Hours Read Pay Rate Display Gross Pay Rounded Rectangle Basic Flowchart Symbols • Notice there are three types of symbols in this flowchart: • rounded rectangles • parallelograms • a rectangle • Each symbol represents a different type of operation. Parallelogram Multiply Hours by Pay Rate. Store result in Gross Pay. Rectangle Rounded Rectangle
START END Display message “How many hours did you work?” Display message “How much do you get paid per hour?” Read Hours Read Pay Rate START END Display Gross Pay Terminal Basic Flowchart Symbols • Terminals • represented by rounded rectangles • indicate a starting or ending point Multiply Hours by Pay Rate. Store result in Gross Pay. Terminal
START END Display message “How many hours did you work?” Display message “How much do you get paid per hour?” Read Hours Read Pay Rate Display message “How many hours did you work?” Read Hours Display Gross Pay Basic Flowchart Symbols • Input/Output Operations • represented by parallelograms • indicate an input or output operation Input/Output Operation Multiply Hours by Pay Rate. Store result in Gross Pay.
START END Display message “How many hours did you work?” Display message “How much do you get paid per hour?” Read Hours Read Pay Rate Display Gross Pay Basic Flowchart Symbols • Processes • represented by rectangles • indicates a process such as a mathematical computation or variable assignment Multiply Hours by Pay Rate. Store result in Gross Pay. Process Multiply Hours by Pay Rate. Store result in Gross Pay.
START END Display message “How many hours did you work?” Display message “How much do you get paid per hour?” Read Hours Read Pay Rate Display Gross Pay Stepping Through the Flowchart Stepping Through the Flowchart Output Operation How many hours did you work? Multiply Hours by Pay Rate. Store result in Gross Pay. Variable Contents: Hours: ? Pay Rate: ? Gross Pay: ?
START END Display message “How many hours did you work?” Display message “How much do you get paid per hour?” Read Hours Read Pay Rate Display Gross Pay Stepping Through the Flowchart Stepping Through the Flowchart Input Operation (User types 40) How many hours did you work? 40 Multiply Hours by Pay Rate. Store result in Gross Pay. Variable Contents: Hours: 40 Pay Rate: ? Gross Pay: ?
START END Display message “How many hours did you work?” Display message “How much do you get paid per hour?” Read Hours Read Pay Rate Display Gross Pay Stepping Through the Flowchart Stepping Through the Flowchart How much do you get paid per hour? Output Operation Multiply Hours by Pay Rate. Store result in Gross Pay. Variable Contents: Hours: 40 Pay Rate: ? Gross Pay: ?
START END Display message “How many hours did you work?” Display message “How much do you get paid per hour?” Read Hours Read Pay Rate Display Gross Pay Stepping Through the Flowchart Stepping Through the Flowchart How much do you get paid per hour? 20 Input Operation (User types 20) Multiply Hours by Pay Rate. Store result in Gross Pay. Variable Contents: Hours: 40 Pay Rate: 20 Gross Pay: ?
START END Display message “How many hours did you work?” Display message “How much do you get paid per hour?” Read Hours Read Pay Rate Display Gross Pay Stepping Through the Flowchart How much do you get paid per hour? Multiply Hours by Pay Rate. Store result in Gross Pay. Process: The product of 40 times 20 is stored in Gross Pay Variable Contents: Hours: 40 Pay Rate: 20 Gross Pay: 800
START END Display message “How many hours did you work?” Display message “How much do you get paid per hour?” Read Hours Read Pay Rate Display Gross Pay Stepping Through the Flowchart Your gross pay is 800 Multiply Hours by Pay Rate. Store result in Gross Pay. Variable Contents: Hours: 40 Pay Rate: 20 Gross Pay: 800 Output Operation
Four Flowchart Structures • Sequence • Decision • Repetition • Case
Sequence Structure • a series of actions are performed in sequence • The pay-calculating example was a sequence flowchart.
Decision Structure • One of two possible actions is taken, depending on a condition.
NO YES Decision Structure • A new symbol, the diamond, indicates a yes/no question. If the answer to the question is yes, the flow follows one path. If the answer is no, the flow follows another path
NO YES x < y? Process B Process A Decision Structure • In the flowchart segment below, the question “is x < y?” is asked. If the answer is no, then process A is performed. If the answer is yes, then process B is performed.
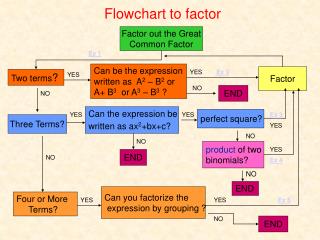
NO YES x < y? Calculate a as x times 2. Calculate a as x plus y. Decision Structure • The flowchart segment below shows how a decision structure is expressed in C++ as an if/else statement. Flowchart C++ Code if (x < y) a = x * 2; else a = x + y;
NO YES x < y? Calculate a as x times 2. Decision Structure • The flowchart segment below shows a decision structure with only one action to perform. It is expressed as an if statement in C++ code. Flowchart C++ Code if (x < y) a = x * 2;
Repetition Structure • A repetition structure represents part of the program that repeats. This type of structure is commonly known as a loop.
Repetition Structure • Notice the use of the diamond symbol. A loop tests a condition, and if the condition exists, it performs an action. Then it tests the condition again. If the condition still exists, the action is repeated. This continues until the condition no longer exists.
YES x < y? Process A Repetition Structure • In the flowchart segment, the question “is x < y?” is asked. If the answer is yes, then Process A is performed. The question “is x < y?” is asked again. Process A is repeated as long as x is less than y. When x is no longer less than y, the repetition stops and the structure is exited.
YES x < y? Add 1 to x Repetition Structure • The flowchart segment below shows a repetition structure expressed in C++ as a while loop. Flowchart C++ Code while (x < y) x++;
YES x < y? Display x Controlling a Repetition Structure • The action performed by a repetition structure must eventually cause the loop to terminate. Otherwise, an infinite loop is created. • In this flowchart segment, x is never changed. Once the loop starts, it will never end. • QUESTION: How can thisflowchart be modified soit is no longer an infiniteloop?
YES x < y? Display x Add 1 to x Controlling a Repetition Structure • ANSWER: By adding an action within the repetition that changes the value of x.
YES x < y? Display x Add 1 to x A Pre-Test Repetition Structure • This type of structure is known as a pre-test repetition structure. The condition is tested BEFORE any actions are performed.
YES x < y? Display x Add 1 to x A Pre-Test Repetition Structure • In a pre-test repetition structure, if the condition does not exist, the loop will never begin.
x < y? Display x Add 1 to x YES A Post-Test Repetition Structure • This flowchart segment shows a post-testrepetition structure. • The condition is tested AFTER the actionsare performed. • A post-test repetition structure alwaysperforms its actions at least once.
x < y? Display x Add 1 to x YES A Post-Test Repetition Structure • The flowchart segment below shows a post-test repetition structure expressed in C++ as a do-while loop. C++ Code do{ cout << x << endl; x++;} while (x < y); Flowchart
Case Structure • One of several possible actions is taken, depending on the contents of a variable.
CASEyears_employed 1 3 Other 2 bonus = 100 bonus = 400 bonus = 800 bonus = 200 Case Structure • The structure below indicates actions to perform depending on the value in years_employed.
CASEyears_employed 1 3 Other 2 bonus = 100 bonus = 400 bonus = 800 bonus = 200 Case Structure If years_employed = 2, bonus is set to 200 If years_employed = 3, bonus is set to 400 If years_employed is any other value, bonus is set to 800 If years_employed = 1, bonus is set to 100
YES x < y? Display x Add 1 to x Combining Structures • Structures are commonly combined to create more complex algorithms. • The flowchart segment below combines a decision structure with a sequence structure.
NO YES x > min? NO YES Display “x is outside the limits.” x < max? Display “x is outside the limits.” Display “x is within limits.” Combining Structures • This flowchart segment shows two decision structures combined.
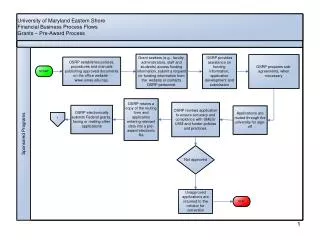
features and benefits of this full-featured visual code editor • 1. Code Visual to Flowchart is a widely used automatic flow chart generator software that can reverse engineering a program, create programming flowchart from code, mostly used on flowcharting a progress • 2. Code Visual to Flowchart can generate Bmp, PNG, Visio, Word, Excel and PowerPoint flowcharts document, help programmers to document, visualize and understand source code. • 3. Code Visual to Flowchart works with the following programming languages: C, C++, VC++ (Visual C++ .NET), VB (Visual Basic), VBA, Qbasic (quickbasic), VBScript (VBS), ASP, Visual C# (C sharp), Visual Basic .NET (VB.NET), Visual J# .NET, VC++.NET, ASP.NET, Java, JSP, JavaScript (JScript), Delphi (Object Pascal), PowerBuilder (PowerScript), Peoplesoft SQR, PHP, Visual FoxPro, PL/SQL, T-SQL (Transact-sql) and Perl.and documenting source code.
4. Code Visual to Flowchart works with flowchart window to help programmers to edit complex source code easily. We can click on any part of the edited code ,and then the related part of flowchart will be highlighted. Flowcharts can be exported in MS Visio or BMP formats on any flowchart expand level. So developers can create code flowchart documents easily. • 5. Current edited code can directly be printed or be exported as RTF or HTML with colors and the format is just the same as its appearance in editor. That is real what you see is what you get. • 6. Code Visual to Flowchart has 2 kinds of flowcharts: The first one is displayed in a way that all the source code is partitioned in fragments and displayed inside the drawn blocks. The other one does not display code in flow chart. Since flow chart can always be synchronized with Editor, it is enough to display the code structure from the source inside of the flow chart. The real code can always be edited in its natural way - inside of the Editor window.
Type 1 Type 2
Another strategy with which Code Visual to Flowchart fights against enormously large flow chart is the concept of expands levels. The maximum depth of displaying the enclosed blocks can always be specified and easily changed. Code Visual to Flowcharts features the quickest navigation of source code and it is also a good assistant when we are working on a programming IDE.
7. Additional features of Code Visual to Flowchart include: Synchronization between flowchart and source code in editor; unlimited programming flow chart expand levels; Syntax highlighting for Source code; Support all Windows system, include Vista and so on.
The Top 5 Reasons To Use Flowcharts(why we use flow chart ) Sometimes it's more effective to visualize something graphically that it is to describe it with words. That is the essence of what flowcharts do for you. Flowcharts explain a process clearly through symbols and text. Moreover, flowcharts give you the gist of the process flow in a single glance. The following are some of the more salient reasons to use flowcharts.
Process Documentation / Training Materials • Another common use for flowcharts is to create process documentation. Although this reason overlaps with regulatory and quality management requirements (below), many non-regulated businesses use flowcharts for their documentation as well. These can range in form from high-level procedures to low-level, detailed work instructions. • You may think that this applies mainly to large organizations, but small companies can greatly benefit from flowcharting their processes as well. Small enterprises need to be nimble and organized. Standardizing their processes is a great way to achieve this.
Workflow Management and Continuous Improvement • Workflows don't manage themselves. To ensure that you are meeting your customers' needs, you need to take control of your business processes. The first step to workflow management is to define the current state of your processes by creating an "As-Is Flowchart". That allows you to analyze your processes for waste and inefficiency. After you have identified areas for process improvement, you can then craft new flowcharts to document the leaner processes.
Programming • Information technology played a big influence on the use and spread of flowcharts in the 20th century. While Dr. W. Edwards Deming was advocating their use in quality management, professionals in the data processing world were using them to flesh out their programming logic. Flowcharts were a mainstay of procedural programming, however, and with the advent of object oriented programming and various modeling tools, the use of flowcharts for programming is no longer as commonplace as it once was.
Notation :- The “Code Visual to Flowchart” is Upper case tools (support analysis and design phases) So its process analysis tools