Download
1 / 19
190 likes | 285 Views
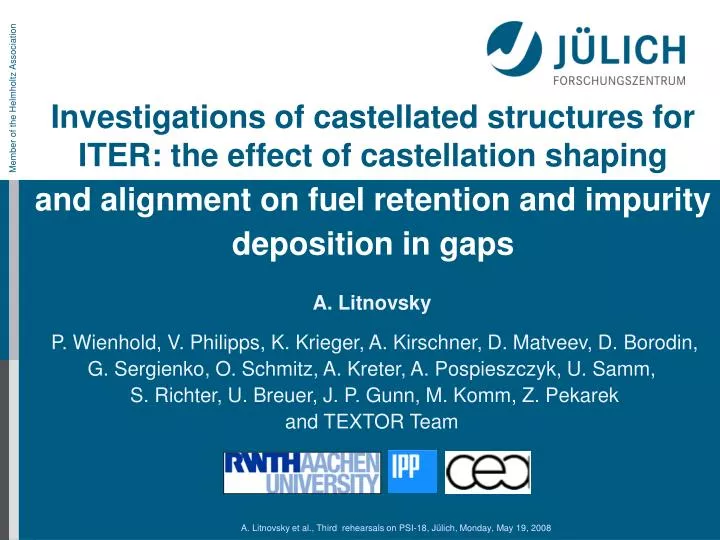
Investigations of castellated structures for ITER: the effect of castellation shaping and alignment on fuel retention and impurity deposition in gaps. A. Litnovsky

E N D
Investigations of castellated structures for ITER: the effect of castellation shaping and alignment on fuel retention and impurity deposition in gaps A. Litnovsky P. Wienhold, V. Philipps, K. Krieger, A. Kirschner, D. Matveev, D.Borodin, G. Sergienko, O. Schmitz, A. Kreter, A. Pospieszczyk, U. Samm, S. Richter, U. Breuer, J. P. Gunn, M. Komm, Z. Pekarek and TEXTOR Team
The divertor and the first wall of ITER will be castellated by splitting it into small-size cells to insure thermo-mechanical durability of ITER Radioactive tritium (the fusion fuel) can be accumulated in the gaps in between the cells Limiter with castellated structures exposed in the SOL of TEXTOR Castellated structures had rectangular and shaped cells Shaping made to minimize deposition in gaps Motivation Castellated vertical target of ITER divertor Investigations at TEXTOR
20o SOL Plasma Poloidal and toroidal gaps Toroidal direction Bt, Ip Shaped and non-shaped cells Toroidal gap Poloidal direction Poloidal gap 20o Bt Rectangular cells Shaped cells Exposure in TEXTOR Details of exposure: 16 discharges, 112 s. Te~20 eV Ne~6*1012cm-3 Averaged fluence 2.2×10²⁰ D/cm2 Bulk temperature 200oC-250oC Local heating of plasma closest edge up to 1500oC W castellated limiter Metallically shiny plasma-facing surfaces: exposure under erosion-dominated conditions We discriminate: Cell dimensions: 10x10x12/15 mm, gap width: 0.5 mm
Secondary-Ion Mass spectrometry SIMS (FZJ) Stylus profiling with DEKTAK (FZJ), Nuclear Reaction Analysis, NRA (IPP Garching) Electron Probe MicroAnalysis, EPMA (RWTH Aachen) Quantification of C and D in the deposits Depth distributions of elements Metal mixing in the deposit and its quantification Trapping ratio of carbon and deuterium in gaps Analyses after exposure Typical scheme of investigations Tasks NRA scan SIMS (calibrated with Dektak) EPMA scan Accuracy of C, D quantification is ~ 20%.
27.3 36 3.0 2.3 3.5 2.5 Strong W intermixing on the plasma-closest edges of gaps (up to 70 at. % of W); W-fraction decreases rapidly with the depth of the gap: λW<λc W intermixing in the deposits: typical examples at. % at. % 41.6 69.6 at. % 43,7% Observations: Metal mixing in the deposits will make cleaning of the gaps difficult in ITER
Plasma 30 0 Plasma open side Plasma shadowed side Maximum deposition on the shadowed side Less peaked profiles in shaped gaps Typical profiles of C and D deposition in poloidal gaps C, D (x10), at./cm2 NRA data Bottom of the gap (later in this presentation) C rect. C shaped. 0 D rect. D shaped. Erosion zone Distance along the gap, mm
Less D in the gaps of shaped cells Comparable C amount Up to 70 at. % W in the deposit Low D/C ratio: D/C<5% Poloidal gaps: results Shaped cells Rectangular cells D, [1015 at] C, [1016 at] D= 0.54 C=11.2 open D=0.96 C=13.9 open D=9.69 C=21 shadowed D=3.03 C=20.4 shadowed Summary: Further shape optimization required e.g. by making the roofs less steep
Bt Significant C deposition and D accumulation detected Less deposition on the left side W intermixing is relatively low Toroidal gaps: results C deposition: 13-25×1016 at. D accumulation: 1-10×1015 at. W fraction: 0-4 at. % Left of field line direction Right of field line direction C deposition: 28-45×1016 at. D accumulation: 1-15×1015 at. W fraction: 5-10 at. % Summary: Shape optimization is necessary
Results: comparison of poloidal and toroidal gaps Comparable amounts of C and D in toroidal and poloidal gaps Toroidal gaps cannot be excluded from analyses of fuel retention and impurity deposition • Material trapped in the gaps For parallel plasma fluence: 6.6*1020 D/cm2 with 3% C in the plasma Dtrap<1.2*10-4 (<0.01% of impinging D flux) Ctrap<0.1 (<10% of impinging C flux)
No clear poloidal / toroidal difference in the deposition: deposition via neutrals? No metal intermixing in the deposits; 80-200 nm Up to 200 nm thick deposits; Same behavior observed in the long-term experiment with ALT tile [1]. Deposition at the bottom of a castellation: first investigations Preliminary results: Bottom surfaces contain about 14% of C amount deposited in poloidal gaps Deposition at the bottom of gaps must be taken into account and understood [1] A. Kreter et al., Meeting of the ITPA TG on DSOL, Avila, Spain, 2008.
Transport along straight lines, reflection at the walls 2 16 10 , at/cm Gap width 0.5mm 30 Carbon Neutral collisions included 20 10 Chemical erosion Homogeneous mixing model (HMM) 0 0 5 10 15 20 25 30 Distance along the gap, mm Reflection or neutral collisions alone cannot explain observed deposition profiles Partial qualitative agreement with experiments (with chemical erosion) Modeling of deposition in the gaps Model Current status Modeling algorithms further to be improved
The limiter was exposed in the erosion-dominated conditions. Nevertheless, there are deposition-dominated conditionsin the gaps. Significant amount of W found intermixed into deposit.This will provide difficulties in cleaning deposits in the gaps; At least two times less D in the poloidal gaps of shaped cells. Less than 30% difference in C deposition.Geometry has to be further optimized; Toroidal gaps contain comparable amount C and D as poloidal onesand cannot be excluded from analyses of carbon transport and fuel accumulation; About 10% of impinging C and less than 0.01% of impinging D fluxes was trapped in the gaps; Deposition at gap’s bottom cannot be described by the simple particle reflection and calls for the further clarification of deposition mechanisms; Modeling of C deposition reproduced only partly the experimental deposition patterns.Further improvement of algorithms is needed. Summary
Further steps Better characterization of the deposits at the bottom of the gaps: NRA in IPP Garching. Plasma background in the gaps: Ne, Ni, Te, Ti, vpar (J. Gunn, CEA) to be introduced in the modeling codes Gap New exposure of castellated limiter: cells with conventional and optimized shaping at three different angles to magnetic field. Additional slide 1
C and D Trapping ratio in the gaps • Parallel plasma fluence: 6.6*1020 D/cm2 • to e-side: 2.2*1020 D/cm2 • to i-side: 4.2*1020 D/cm2 • assuming 3% of C in plasma: • to e-side: 6.6*1018 C/cm2 • to i-side: 12.6*1018 C/cm2 • To be compared with: • Maximum D content in the poloidal gaps: 1.1*1016 D • Maximum D content in the toroidal gaps: 2.7*1016 D • Maximum C content in the poloidal gaps: 3.5*1017 C • Maximum C content in the toroidal gaps: 6.5*1017 C • Which yields to: • Dtrap<1.2*10-4 (<0.01% of impinging D flux) • Ctrap<0.1 (<10% of impinging C flux) Additional slide 2
190 90 136 61 A6 A5 A4 A3 53 plasma flow A2 90 190 A1 136 190 61 225 190 A8 A7 A6 136 A5 A4 61 A3 53 53 A2 190 225 190 A1 136 61 53 Toroidal gaps: quantification of deposits P. Wienhold • 2D deposition patterns were selected, based on the color of a deposit • For each pattern the thickness was taken based on NRA/EPMA/SIMS results • This thickness was cross-calibrated with colorimetrical tables • Thickness was then re-calculated to the total amount of atoms and multiplied to the area of the deposition patterns Additional slide 3
Toroidal gaps: the nature of deposition Left of field line direction Bt Right of field line direction • Similar deposition patterns on toroidal gaps independently on plasma-shadowing • Cannot be described based on misalignment of magnetic field • May be explained by gyro-motion of particles plasma shadowed side plasma viewing side Plasma Plasma Bt plasma shadowed side D+,Cx+ plasma viewing side • Gap width 0.5 mm • RL(D+) ~ 1.6 mm • RL(C4+) ~ 1 mm Bt • Gap width might be decisive Additional slide 4
Plasma flow A C, at/cm2 B Distance along the gap, mm W intermixing in the deposit EPMA, NRA, SIMS/DEKTAK EPMAmodeled value (41 at. % W in the deposit) SIMS/DEKTAK value ~ 50 nm A: Plasma facing side of the gap NRA value ~ 42 nm EPMA value (without W mixing) ~ 25 nm ~ 1 mm NRA scan SIMS (calibrated with Dektak) EPMA scan Additional slide 5
Plasma-open sides Plasma-shadowedsides Additional slide 6