Download
1 / 16
160 likes | 272 Views
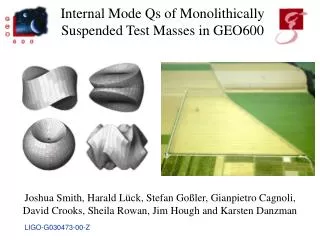
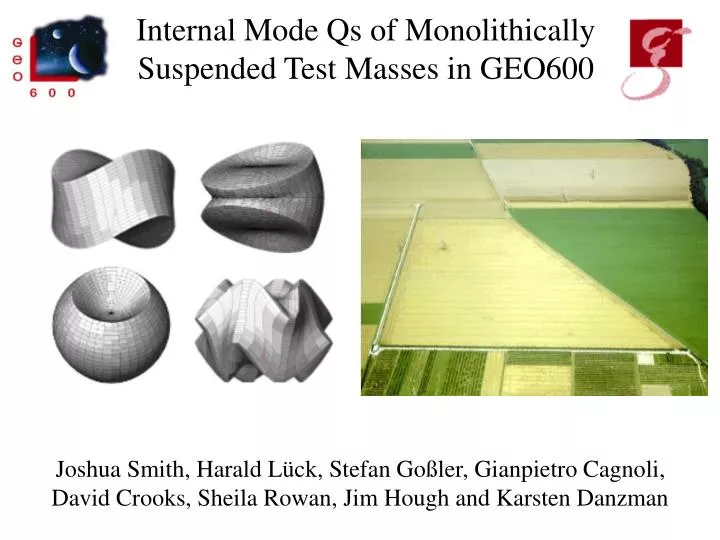
Internal Mode Qs of Monolithically Suspended Test Masses in GEO600. Joshua Smith, Harald Lück, Stefan Goßler, Gianpietro Cagnoli, David Crooks, Sheila Rowan, Jim Hough and Karsten Danzman. Wire sling. Monolithic. Simplified GEO600 Optical Layout. MFn. MCn. MFe. MPR.

E N D
Internal Mode Qs of Monolithically Suspended Test Masses in GEO600 Joshua Smith, Harald Lück, Stefan Goßler, Gianpietro Cagnoli, David Crooks, Sheila Rowan, Jim Hough and Karsten Danzman
Wire sling Monolithic Simplified GEO600 Optical Layout MFn MCn MFe MPR Light from modecleaners BS L = 1200 m MSR MCe Output PD
Mirror Contributions to Strain For GEO we have: Where L is arm length (1200 m) and 2L is the differential arm length change. Considering contributions from each test mass: where X is mirror motion in m.
Internal Modes • Mode shapes, freq’s determined using ALGOR. Cross-checked using ANSYS (Jena). See poster: A. Zimmer, S. Nietzsche, W. Vodel, M. Thürk, F. Schmidl, P. Seidel "FE analysis of the structural dynamics of mirror substrates" • Agreement between calculated and measured frequencies ~ 0.1 to 1 %. (ANSYS and ALGOR), that’s ~ 10 to 100 Hz • More precision not expected as models without flats, standoffs
Q Results All Qs are in millions Qmax = 3.8 x 10⁶
Test Mass Internal Losses Loss of a GEO test mass for a given mode can be expressed as a sum of the effective losses (loss factors scaled by energy ratios) of its constituent materials:
Bulk Effective Loss: effbulk • bulk 2x10⁻⁸ (Penn et al) • standoff bulk , while Estandoffs Ebulk, so loss from standoffs is negligible. effbulk + effstandoffs 2x10⁻⁸
Effective Loss of the Bonds: effbonds Measurements of other GEO-like bonds: (Sodium silicate bond sol’n containing SiO2 ) • bond = 1.8x10⁻¹ to 5.4x10⁻¹ (Glasgow) • tbond = 81 nm (Glasgow) These Give: effbonds 3.4 x 10⁻⁹ to 1.0 x 10⁻⁸
Effective Loss of the Coating: effcoating GEO test mass coatings: • 30 layers of silica/tantala /4: /4 • tcoating = 4.3 m (Penn et al) • coating = 2.8x10⁻⁴ (Crooks et al) This gives: FEA for BF and drum modes (Crooks): effcoating 1.2x10⁻⁸ effcoating 5x10⁻⁸
ESD Damping d C I dissipation in real impedance (R) (Mitrofanov, Strain) With 40 k output resistor, for f > 10 kHz, Feedback from control loop also negligible as UGF ~ 100 Hz QESD ~ 109
Loss Conclusions eff = effbulk +effstandoffs + effbonds + effcoating 4x10⁻⁸ Qeff 2x10⁷ • Measured Qs cannot be entirely explained by loss of TM constituent materials. • Energy distribution will not be uniform, will vary mode to mode • Does not take surface loss from barrel polish or back surface polish into account (but should be < coating). • Could also be non-negligible energy lost to intermediate mass • Erratic Qs suggest energy dissipated in fibers (Logan et al, Braginsky et al) • This should not degrade TN away from violin modes (Logan et al)
Thermal Noise Calculations • Use corrected Levin method (Liu, Thorne, Nakagawa) • Take inverse Qmax as upper limit for substrate loss for each mirror. • Use measured beam radius for each mirror: (1 to 2 cm (E0/e2)). • Model coating as thin surface layer (Nakagawa et al) with: • tcoating = 4.3m • coating = 2.8x10⁻⁴ • at 100 Hz we have hint 2.2x10⁻²² [Hz-1/2]
Summary • calculations represent a preliminary estimate based on measured values (Q, r0) • measured Qs only lower limits • not all mirrors measured (BS, MFe) • FEA needed for more precise calculations: Allows to apply Levin Pressure directly, calculate energy ratios in each volume use these to scale measured loss factors to determine TN • GEO should reach internal thermal noise for narrowband operation above 300 Hz (thermorefractive noise slightly higher at lower f’s) • Await measurements from the interferometer !