Download
1 / 41
430 likes | 596 Views
Radar Polarimetric Retrievals. Anthony Illingworth. University of Reading, UK. RADAR REFLECTIVITY, Z. FOR RAIN Z = N D 6 (mm 6 m -3 ) SIXTH MOMENT: dBZ = 10log(Z) RAINRATE: R = N D 3.67 3.67 TH MOMENT EMPIRICALLY Z = aR b “Z= 200 R 1.6 ” ERROR ‘FACTOR OF TWO’

E N D
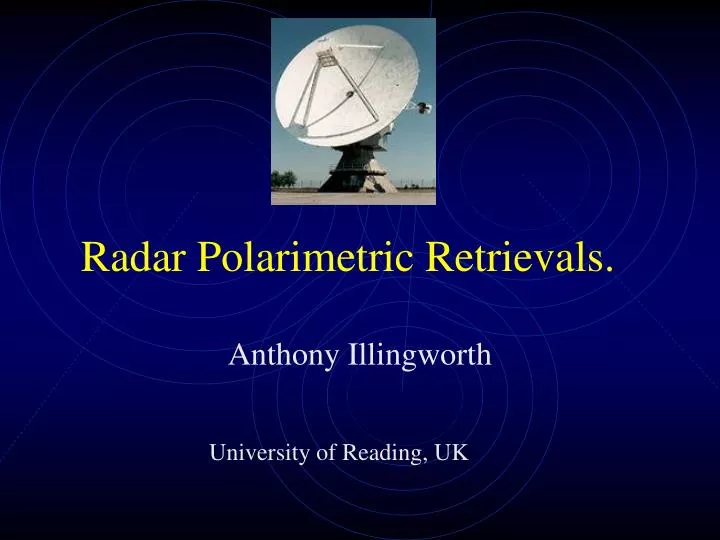
Radar Polarimetric Retrievals. Anthony Illingworth University of Reading, UK
RADAR REFLECTIVITY, Z FOR RAIN Z = N D6 (mm6 m-3 ) SIXTH MOMENT: dBZ = 10log(Z) RAINRATE: R = N D3.67 3.67TH MOMENT EMPIRICALLY Z = aRb “Z= 200 R1.6” ERROR ‘FACTOR OF TWO’ Z has no information on hydrometeor characteristics
WHAT IF TARGET IS ICE? Z = (Kice/Kwater)2N D6 (Kwater)2 = 0.93 and Kice = (ice) 0.205 So K of fluffy snow is very low, now, mass = * volume so for dry ice Z prop to mass 2 If ice is wet: K2 =0.93 so Z much higher: So melting snow: high Z – bright band. HAIL – D large – Z = 60dBZ So Z= 200 R1.6 Gives R=200mm/hr
WHAT CAN POLARISATION ADD? TRANSMIT AND RECEIVE HORIZONTALLY AND VERTICALLY POLARISED WAVE. FOUR NEW PARAMETERS. Consider at low elevation DIFFERENTIAL REFLECTIVITY: ZDR MEASURE REFLECTIVITY WITH HORIZONTAL (ZH) AND VERTICAL (ZV) POLARISATION ZDR = 10 LOG(ZH/ZV)
1mm ZH =ZV ZDR = 10LOG(ZH/ZV)=0dB ZDR MESURES MEAN PARTICLE SHAPE – e.g. RAIN. ZH > ZV ZDR = 2dB 3mm ZH >>ZV ZDR = 4 dB 5mm • RAIN: ZDR IS A MEASURE OF MEAN DROP SHAPE/SIZE • HAIL: TUMBLES SO ZDR=0dB • SNOW/AGGREGATES: look spherical to radar, ZDR=0dB.
OBLATE HYDROMETEORS (E.G LARGE RAINDROPS) DELAY H WAVE MORE THAN V WAVE. PHASE DIFFERENCE, DP, INCREASES WITH RANGE KDP is grad of dp in deg/km 2. DIFFERENTIAL PHASE SHIFT, KDP RAIN – KDP R: HAIL NO KDP AGGREGATES – NO KDP PRISTINE XLS – SOME KDP
Z >40dBZ In heavy rain ZDR>2dB In heavy rain Phase shift 40degs thru heavy rain ZDR AND KDP IN RAIN
3. LINEAR DEPOLARISATION RATIO, LDRTransmit H, receive H (copolar) and V (x-polar)LDR = 10 log(x-polar/copolar) X-polar return only from oblate particles falling an angle to H or V Highest return for high K – if particles are wet Wet snowflakes LDR = -12dB Dry Pristine Crystals -24dB Dry snow flakes and rain LDR < - 30dB
t=1 T=2 4. Copolar correlation, (hv)the correlation between time series of ZH and ZV If particles all the same shape = 1 Variety of shapes, variety of ratio ah/av then < 1 Rain: >0.98 bright band: approx 0.9 Ground clutter and anaprop (Mie scatter): = 0.
POLARISATION PARAMETERS FROM CLOUDS LIQUID DROPLETS <1mm SPHERICAL – NO SIGNAL LOW DENSITY AGGREGATES – LOOK SPHERICAL TO THE RADAR – NO SIGNAL FROM MOST ICE CLOUDS. PRISTINE CRYSTALS – viewed at low elevation can have high ZDR and some kdp when viewed at low elevation. If aggregates present then ZDR=0dB, but kdp unaffected Can’t use kdp to estimate iwc because iwc dominated by aggregates. Special case of crystals aligned in electric field in thunderstorm: Where field vertical - negative kdp. Where field at 45 degs – get ldr Can ‘map’ out field – see our web site.
POLARISATION PARAMETERS FROM CLOUDS PRISTINE CRYSTALS – viewed at zenith NO ZDR OF KDP (except when alignment in electric field) THEY CAN GIVE LDR OF ABOUT –24dB But X-POLAR RETURN USUALLY BELOW DETECTION LIMIT AT ZENITH IDENTIFY MELTING LAYER LDR= -13dB IN PRECIPTATING CLOUDS CAN IDENTIFY GRAUPEL FROM SNOW BY DIFFERENT LDR WHEN THEY MELT.
WHAT USE IS RADAR FOR LWC AND IWC? 1. DIFFERENTIAL ATTENUATION BETWEEN 94 AND 35GhZ RADAR IN LIQUID CLOUDS IS ABOUT 8dB/km/g/m3 BUT NEED LONGISH DWELLS TO GET PROFILES OF LWC 2. ICE PARTICLE SIZE: 94GHz Mie SCATTERS ONCE D>0.3mm; 35GHz RAYLEIGH SCATTERS SO DUAL WAVELENGTH REFLECTIVITY RATIO GIVES Do IF Do > 0.3mm ONCE YOU KNOW Do, THEN Z AT 35GHz GIVES YOU N DERIVE IWC – ERROR DEPENDS ON ICE DENSITY f(D) GET THIS FROM DUAL DOPPLER VELOCITY DIFFERENCE
CLOUDNET: • Two years of 24h/7d radar/lidar observations • Cabauw, Palaiseau, Chilbolton • Categorisation of echoes – ice, liquid, scooled etc. • Derive cloud fraction, iwc, lwc, etc. • + ERRORS • Model data from ECMWF, MeteoFrance, Met Office, RACMO – over the three stations for two years. For real time cloud profiles visit: www.met.reading.ac.uk/radar/realtime And for CloudNET “ /radar/cloudnet/
Cloud fraction: 10 day comparison with ECMWF model • Initial comparison suggests that clouds are very well represented by the ECMWF model • Remember that for 20 m/s wind, one day of data is equivalent to 1700 km of cloud, so very large scale features are being compared here!
However, frequency of occurrence is better: suggests humidity structure is good, but amount when present is not so good • Low-level clouds are very different in the two models Cloud fraction:12 Months of Chilbolton data • Too much cloud high levels, too little mid-levels
Seems to be due to factor-of-2 error in mean cloud fraction • Mean in-cloud IWC appears to be reasonably good above 4 km Ice water content (from Z) results • Underestimate of mean mid-level IWC in both models (g m-3)
BEST APPLICATION OF POLARISATION IS FOR BETTER RAINRATES. ZDR GIVES YOU MEAN DROP SIZE + Z GIVES YOU N: BETTER ESTIMATE OF RAIN SIZE SPECTRA – BETTER R KDP – PHASE SHIFT – MEASURABLE IN HEAVY RAIN a) R = f(KDP) GIVES R WHEN HAIL PRESENT. b) PHASE SHIFT PROPORTIONAL TO Z ATTENUATION SO METEO FRANCE AND MET OFFICE WILL INSTALL AN OPERATIONAL POLARISATION RADAR IN 2004
- melting snow :bright band - rapid fall of Z in the ice - near the ground beam in the rain R from Z alone: major problem is Vertical profile of reflectivity 30dBZ 0dBZ OPERATIONAL RADAR – BEAM 1DEG – 2km WIDE AT 100km RANGE.
SUMMARY OF PROBLEMS (AND SOLUTIONS) OF DERIVING R FROM Z ALONE VERTICAL PROFILE OF REFLECTIVITY - USE LDR TO IDENTIFY THE B BAND? ATTENUATION AT C-BAND – USE DIFF PHASE ANAPROP AND CLUTTER USE ABSOLUTE CALIBRATION OF Z - USE REDUNDANCY OF ZDR AND KDP IN HEAVY RAIN TO CALIB TO 0.5dB. BETTER RAINDROP SPECTRA - USE ZDR.
FOR ZDR AND KDP DROP SHAPE MODEL CRUCIALUSE ANDSAGER/GODDARD SHAPES
FOR BETTER RAINRATES NEED ZDR ACCURATE TO better than 0.2dB Curves are value of Z for R=1mm/hr for a given ZDR. If observed Z is xdB Higher then R is xdB Above 1mm/hr
KDP ONLY USEFUL FOR HEAVY RAIN e.g. 1deg/km is about 40mm/hr.difficult to measure lower values of KDP
In rain Z, ZDR and KDP are not independent KDP/Z is a unique function of ZDR: SO along a ray at each gate from observed Z and ZDR calculate theoretical KDP, find theoretical dp per gate. Adjust Z so computed phase shift agrees with observed phase shift Z CALIBRATION TECHNIQUE: Correct shapes
Z >40dBZ In heavy rain ZDR>2dB In heavy rain Phase shift 40degs thru heavy rain ZDR AND KDP IN RAIN
Observed phase shift along ray is 25 degs. Adjust Z, so that phase shift calculated from observed Z and ZDR agrees with observed phase shift. CALIBRATION EXAMPLE
Polarisation Rainfall Technique • R from Z and Zdr • Need ZDR to 0.1dB at 3mm/hr for R accurate to 25% • Operationally ZDR too noisy for accurate gate by gate R. • Noise due to sidelobe mismatch, triple scattering etc. • SUGGEST • Use domain average so noise in ZDR averages to zero. • Calculate best Z-R domain relation from Z and ZDR. • Rainfall accuracy of 25% possible for R = 3mm/hr • See chapter 5 in Peter Meischner’s (Ed.) forthcoming book: • Weather Radar: Advanced Applications – Springer.
Polarisation Rainfall Technique • R from Z and Zdr • Need ZDR to 0.1dB at 3mm/hr for R accurate to 25% • Operationally ZDR too noisy for accurate gate by gate R. • Noise due to sidelobe mismatch, triple scattering etc. • Use domain average so noise in ZDR averages to zero. • Calculate best Z-R domain relation from Z and ZDR. • Rainfall accuracy of 25% possible for R = 3mm/hr • Diff phase shifts only good for heavy rain. • Rain of < 30mm/hr caused the flooding of central Europe • Use Diff phase shift in heavy rain to calibrate Z to 0.5dB.
Drop Spectra: Normalised Gamma Function • We assume that the drop spectra can be represented by the normalised gamma distribution • Do = Median volume drop size • The average size of the drops • Nw = Normalised drop concentration • Normalised for constant liquid water content with changes in m • The number of drops • m= width of spectrum • High values correspond to a narrow drop spectrum – most drops about the same size. Where: Do= 1 mm, Nw= 8000 m-3mm-1 104 103 102 101 100 10-1 Number of drops / m3 / mm 0 0.5 1 1.5 2 2.5 Drop size (mm)
Z-R if Nw constant • We will now presume m = 5 • Nw and Do can vary • Now suppose that as rain gets heavier, Nw remains constant, but Do increases. • The ‘ZPHI’ method of Testud et al (2000) assumes Nw is constant and derives it and hence a from the integrating along the ray, using Z and the total differential phase shift. Nw= 8000 m-3mm-1, m = 5 103 102 101 100 Number of drops / m3 / mm 0 1 2 3 4 5 6 7 Drop size (mm)
Heavier rain Do Increases: Nw Do-1 • If: Nw Do-1 • As drops get bigger, there are less of them. • This is the UK default • Stratiform rain. R1.6 • More ice aggregation • Larger but fewer snowflakes m = 5 104 103 102 101 Number of drops / m3 / mm 0 1 2 3 4 5 6 7 Drop size (mm)
Heavier rain Do Increases: Nw Do2 • If: Nw Do2 • More, larger drops as rain increases • Similar to the NEXRAD default of Z R1.3 • Convective/tropical rain? m = 5 104 103 102 101 Number of drops / m3 / mm 0 1 2 3 4 5 6 7 Drop size (mm)
R from Z and ZDR • ZDR is independent of Nw , so gives us Do • Fixed ZDR normalized gamma Do const. • For fixed ZDR, Z and R scale with Nw • For each ZDR calculate Z for R=1mm/hr • dBZR=1= f (ZDR) • Use Andsager (‘99) or Goddard(’84) shapes • Hence, dBR = dBZOBS – f (ZDR)
Example: dBR = dBZobs – f(ZDR) • Observed ZDR=0.65dB • For this ZDR: R of 1 mm/hr has 26.4dBZ • Observed 36.4dBZ, so R=10dBR or 10mm/hr Need ZDR to 0.1dB @ 3mm/hr to 25% dBZobs 1mm/hr f(Zdr) Now use to plot log R – dBZ space to calculate a and b
Case Study 9 Oct 2000 Stratiformarea Convectivearea
Convective case • Data from a square side 4km. • Nw less than 8000 m-3 mm-1. • Nw seems to increase as R increases. • Expect b < 1.5 • Accuracy of observations • Z 0.7dB • ZDR 0.2dB
Convective case • Convert Z and ZDR to log R – dBZ space • ‘SD - line’ • Slope slog Z / slog R • Passing dBZ & log R • a from intercept • b from slope • Error in R ± std • For given Z, R changes 3dB which is factor of 2: but SD fit is to within 25% • This data gives a=340, b=1.37 Z=340R1.37 25% spread
Stratiform case • Data from square side 4km. • Nw reduces as Do increases • Expect b larger than 1.5
Stratiform case • Convert Z, ZDR to logR – dBZ space • Individual Z-R spread gives R spread 5dB. • S-D line: given Z, R changes 1dB, 25% • This data gives a=300 & b=1.58 Z=300R1.58 25% spread
Summary • Different Z-R from domain averaged Z and ZDR. • Individual Z-ZDR rainfall has big spread. • Domain average spread in R is 1dB. • The rain rate calculated from the 2 cases is quite different for rainrates >5mm/hr
Rainfall maps • a and b are calculated over small areas and these then used to calculate R form Z=aRb