Download
1 / 6
60 likes | 182 Views
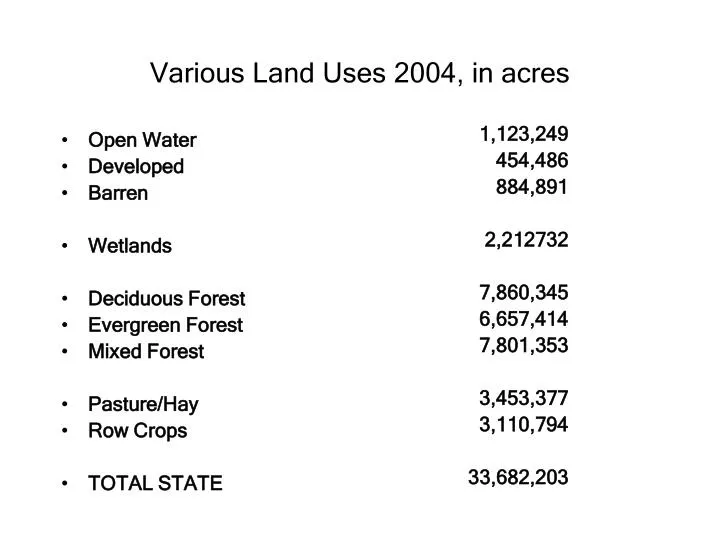
Open Water Developed Barren Wetlands Deciduous Forest Evergreen Forest Mixed Forest Pasture/Hay Row Crops TOTAL STATE. 1,123,249 454,486 884,891 2,212732 7,860,345 6,657,414 7,801,353 3,453,377 3,110,794 33,682,203. Various Land Uses 2004, in acres.

E N D
Open Water Developed Barren Wetlands Deciduous Forest Evergreen Forest Mixed Forest Pasture/Hay Row Crops TOTAL STATE 1,123,249 454,486 884,891 2,212732 7,860,345 6,657,414 7,801,353 3,453,377 3,110,794 33,682,203 Various Land Uses 2004, in acres
Land in Various Ag Uses 2002(from USDA Bulletin 45, page 11) 1000 acres 1000 dollars • Corn 400 42,768 • Cotton lint 590 117,300 • Hay 800 96,800 • Peanuts 190 63,714 • Soybeans 170 19,902 • Winter Wheat 150 6,960 • Sweet corn 1.9 1,972 • Tomatoes 1.2 7,438 • Watermelons 4.0 2,933 • Peaches - 8,360 • Floriculture (page 28) - 66,234
Livestock and Poultry Receipts 2002(from USDA Bulletin 45, page 29) Million dollars % Total • Broilers 1,610 67.6 • Cattle and calves 305 12.8 • Eggs 297 12.5 • Catfish 76 3.2 • Dairy 38 1.6 • Other 34 1.4 • Hogs 20 0.9 • TOTAL about 2,380
Revenue from Major Ag Sources(1000 dollars; from USDA Bulletin 45, page 44-45) • Standard Ag (crops) 583,800 (row crops, orchard, etc.) • Floriculture 66,234 • Animal husbandry 2,378,300 (including aquaculture) • Hunting, fishing, recreation 2,400,000 (This figure is the approximate official statistic, from Steve Guy of ALFA. We are trying to get data on unofficial hunting revenues too) • Forestry 735,150
Who Produces How Much The next slide shows that a minority of the farms (about 8%) produces a majority of the crops by value (about 82%). According to Herb Vanderberry of the Alabama State Division of the USDA, the same small group of farms (about 11%) own about 30% of the farmland in Alabama. This does not mean there is no place for small farms or family fams, but only that small farms have been under stress, the rural way of life is changing, and rural people need to consider many options.
Who Produces How Much (from 1997 Ag Census) Farm size range % Total Farms %Total Ag Sales Less than $10,000 68.9 2.7 $10,000 - 49,000 16.5 4.5 $50,000 – 99,999 3.3 3.1 $100,000 – 249,000 3.5 7.6 $250,000 – 499,000 3.3 16.2 $500,00 or more 4.5 65.9