Download
1 / 16
160 likes | 283 Views
SEA SPRAY DROPLET MEASUREMENTS IN HURRICANES FABIAN AND ISABEL C. W. Fairall *, J. E. Hare, and A. A. Grachev NOAA Environmental Technology Laboratory (ETL) Boulder, CO. Background Instruments Data processing Results. Surface Source Strength for Sea Spray Droplets:

E N D
SEA SPRAY DROPLET MEASUREMENTS IN HURRICANES FABIAN AND ISABELC. W. Fairall *, J. E. Hare, and A. A. GrachevNOAA Environmental Technology Laboratory (ETL)Boulder, CO • Background • Instruments • Data processing • Results
Surface Source Strength for Sea Spray Droplets: A function of drop size and forcing
Droplet Source Strength: Deduced from or tuned to droplet concentration data Above the source region, Sn =0. Vertical transport balances fall velocity in equilibrium so constant=0 Within source region, Sn≈ Vg n
Samples from Wind Tunnel StudySPANDEX Droplet spectra profiles Droplet spectra normalized by power law equation
Surface-based droplet data, z=15 m. Droplet fall velocity as a function of size
Droplet Measurement TechnologyCloud Imaging Probe (CIP)62 size bins, 25- 1550 micron diameter
Droplet Concentration Droplet concentrations are computed from droplet counts in each size bin using the expression where U is true airspeed in cms-1, dt the sample time interval, dr the sample radius bin width (12.5 μm), and a the size-dependent sample cross-sectional area in cm2 (provided by the manufacturer).
Fall CBLAST P-3 Flights • Aug 21 Test flight --- • Sept 02 Fabian 1 9 steps 67-780 22 m/s • Sept 03 Fabian 2 8 steps 154-760 23 m/s • Sept 04 Fabian 3 5 steps 94-360 19 m/s • Sept 12 Isabel 1 10 steps 83-360 23 m/s • Sept 13 Isabel 2 9 steps 63-360 23 m/s
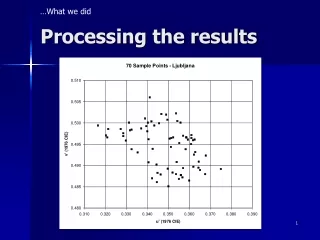
Data from Sept. 2 and 13 Green – median counts and blue – total counts for 10 step legs on both days (0.1 means 0).
Ntot = 0.15/m3 Mass= 0.4 to 4 10-3 g/m^3 Flux = 0.6 to 8 mm/hr
CBLAST Droplet Volume Spectra Blue and Green – CIP data; Red line – Double exponential fit; Dashed black lines FASTEX (ship) and HEXMAX (platform) for U10=22 m/s.