Download
1 / 17
170 likes | 614 Views
Heavy-duty vehicle test facility at VTT Excellent tool to determine the effect of traffic environment on emissions and energy use Juhani Laurikko 10 June 2008 VTT Press Conference Via Nordica Required power vs. speed Key issues

E N D
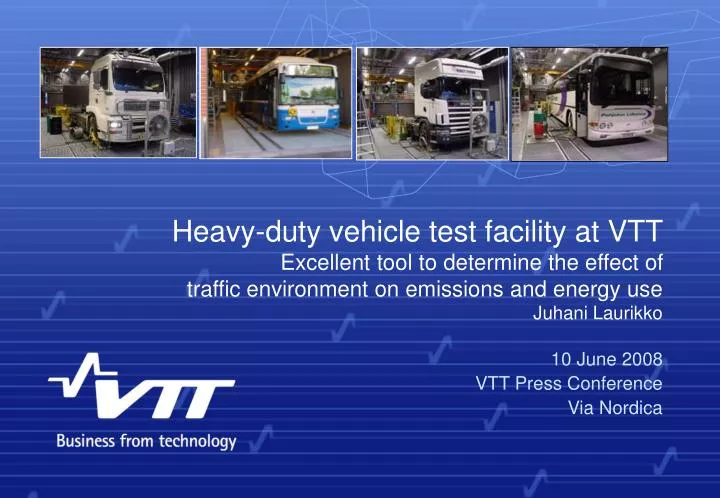
Heavy-duty vehicle test facility at VTT Excellent tool to determine the effect of traffic environment on emissions and energy use Juhani Laurikko 10 June 2008 VTT Press Conference Via Nordica
Key issues • At constant speed and on level ground motor vehicle energy use and emissions are at the lowest. • However, vehicles are subjected to the effects of street or road environment and local traffic situation, inducing changes in speed and at utmost, complete stops and re-accelerations. • Because normal motor vehicles are not able to recuperate the kinetic energy, all decelerations, stops and re-accelerations increase energy consumption. • The actual way of driving is usually referred as “duty-cycle”, and it may vary considerable with regard to: • vehicle type: urban bus / delivery truck / long-haul truck • traffic environment: city centre / rural road / motorway • VTT is able to simulate actual on-road duty-cycles in laboratory environment with the ability to accurately determine energy consumption and exhaust emissions including particulates.
Heavy-duty vehicle test facility at VTT Transient-load dynamometer for full-size heavy vehicles • Maximum vehicle inertia 60 tonnes • Power absorption up to 300 kW at wheels, equals 500 hp at engine • Accurate fuel consumption and exhaust emission measurements, incl. particulate matter (PM) size and mass Enables realistic duty-cycle simulation • Ability to include also road gradient Versatile tool to assess • duty-cycle responses, i.e. determine the effect of driving type and traffic environment • vehicle performance, i.e. compare different brands and configurations
The effect of duty cycle • In actual driving, engine speed and load (torque) change almost all the time. • The eventual fuel consumption and energy use is determined by the spread of these momentary speed & torque pairs over the operating “map” of the engine, as energy consumption and exhaust emissions are not constant over the whole operating range. • Different driving cycles produce different spread over the “map” and thus their respective results are also different. • Due to the variations in engine characteristics, vehicle to vehicle responses may vary depending type of driving (urban, road etc.).
Duty-cycle for urban delivery driving • Urban delivery operations are characteristically stop-and-go –type of driving with lots of changes in speed. • Therefore, specific fuel consumption over distance travelled (l/km) as well as related to transport work done (l/tonn-km) are usually much higher than in open road type of operations. • Typical values for 18 to 22 trucks in this type of duty is 25 to 42 l/100 km or 0.04 l/tonn-km,
Characteristics for driving on rural roads • Speed in open road driving is typically less transient than in urban street environment. • However, especially in heavy trucks, road gradient has a major impact on power requirement and hence also consumption and exhaust emissions. • At those steepest uphills, full engine power may not be sufficient to maintain speed, and a drop in speed is inevitable. • As higher gradients are acceptable for normal roads than over motorways this may result in somewhat higher consumption in road vs. motorway driving. • Typical fuel consumption values for heavy trucks (42 and 60 tonnes) are 22 to 53 l/100 km, depending on total mass.
Characteristics for driving on motorways • Speed on motorway is usually constant, and governed by the speed limiter (max. 89 km/h). • However, especially in heavy trucks, road gradient has a major impact on power requirement and can raise engine power to maximum level even at a modest grade (1 to 2%). • This has inevitable effect on fuel consumption and exhaust emissions. • At those steepest uphills, full engine power may not be sufficient to maintain speed, and a drop in speed is inevitable. • Specific fuel consumption in this type of driving is usually around 0.015 l/tonn-km.
Vehicle comparisons • Due to the variations in engine characteristics, vehicle to vehicle responses may vary depending the type of driving (urban, road motorway). • Therefore, fuel consumption of different vehicle brands may also differ, even if the vehicles are targeted to same kind of operations. • According to our experiments using actual real-life duty- cycles, this variation may be as high as 15% at maximum, but is typically less than 10%.