Download

1 / 54
540 likes | 792 Views
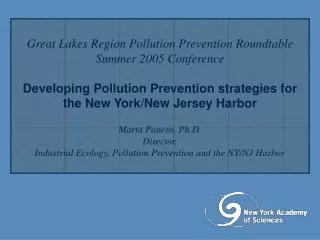
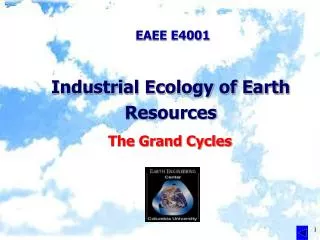
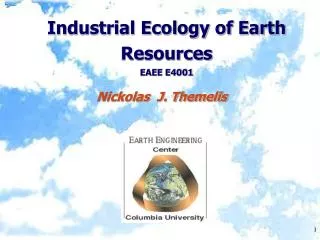
Industrial ecology of earth resources EAEE E4001. MANAGING THE WATER RESOURCES INVITED LECTURE BY PROF. UPMANU LALL . Decision Analysis Tools for Total Maximum Daily Loads - EPA's Water Quality Management Program. Presentation by Prof. Upmanu Lall, Earth and Environmental Engineering.

E N D
Industrial ecology of earth resources EAEE E4001 MANAGING THE WATER RESOURCES INVITED LECTURE BY PROF. UPMANU LALL
Decision Analysis Tools for Total Maximum Daily Loads - EPA's Water Quality Management Program Presentation by Prof. Upmanu Lall, Earth and Environmental Engineering
Outline • The Playing Field • The Clean Water Act, Water Quality and the EPA • The Problem • Management or Regulation ? Data, Science, Problem Scale and Decisions • An Approach • Emphasis on Science to support Decision Process • Bayes Networks + Packaging
Fires plagued the Cuyahoga beginning in 1936 when a spark from a blow torch ignited floating debris and oils. Fires erupted on the river several more times before June 22, 1969, when a river fire captured national attention when Time magazine described the Cuyahoga as the river that "oozes rather than flows" and in which a person "does not drown but decays." This event helped spur an avalanche of pollution control activities resulting in the Clean Water Act, Great Lakes Water Quality Agreement, and the creation of the federal and state Environmental Protection Agencies. http://www.cnn.com/NATURE/9906/22/saving.cuyahoga/
Key Legislation mandating EPA’s role in Water National Environmental Policy Act, 1969: Environmental Assessments (EA's) and Environmental Impact Statements (EIS's) for all federal activities Federal Water Pollution Control Act 1972 : Regulates discharges of pollutants to waters Endangered Species Act, 1973: Conservation of threatened/endangered plants and animals and the habitats in which they are found The Safe Drinking Water Act, 1974, 1996: Protect the quality of all waters actually or potentially designed for drinking use, whether from above ground or underground sources. EPA to establish safe standards of purity and required all public water systems to comply with primary (health) standards. State governments, also encourage attainment of secondary standards (nuisance). The Clean Water Act 1977: Focus on toxics. EPA gets authority to set effluent standards on an industry basis (technology-based) and water quality standards for all contaminants in surface waters. The CWA makes it unlawful for any person to discharge any pollutant from a point source into navigable waters unless a permit (NPDES) is obtained. Comprehensive Environmental Response, Compensation, and Liability Act, 1980: Federal “Superfund” to clean up uncontrolled or abandoned hazardous-waste sites as well as accidents, spills, and other emergency releases of pollutants and contaminants into the environment The Clean Water Act 1987: authorized citizen suit provisions, and funded sewage treatment plants (POTW's) under the Construction Grants Program. EPA can delegate many permitting, administrative, and enforcement aspects of the law to state governments. Resource Conservation & Recovery Act, 1976, 1986: Underground Storage Tanks, Non-Haz Waste
Assessed Rivers, Lakes, and Estuaries Meeting All Designated Uses 1994/1996 Using Latest State Information Reported - EPA
Major Water Quality Concerns Today • Non-point source Pollution (e.g., Agricultural Sources, Urban Runoff) • Nutrients (P, N), Sediment, Stream temperature, Dissolved Oxygen, Pathogens, Pesticides • Organics in Urban Runoff • Eutrophication • Endangered Species/Habitat/Riparian Zone, Recreation Impacts • Climate Variability and Dynamic Range of Biophysical Processes • Rapid Urbanization/Shifts in Land Use • Competition between Environmental and Agricultural/M&I demands • Paucity of Data in Space and Time • Limited Understanding of Long Term Impacts in Ephemeral Streams
-EPA Sediments Nutrients Pathogens Dissolved Oxygen Metals Habitat pH Suspended Solids Temperature Flow Alterations Pesticides Noxious Plants Turbidity Fish Contamination Ammonia 0 18 % of Water Segments
Sediment Runoff Potential - 1990-1995 Nitrogen Runoff Potential - 1990 -1995 Pesticide Runoff Potential - 1990 -1995 Fish Consumption Advisories - 1997
Key Points • TMDLs - legal domain dominates process - policy or science issue ? • Major Public Sector Expenditures and Urgency - Legal Impetus • 40,000 TMDLs @ $100k each = $4 billion EPA expense in 10 yrs • There are significant data gaps to even evaluate existing conditions • Natural climatic variability leads to short and long range effects on the landscape that complicates the assessment of sediment, nutrient, and other inter-related “loads” that result from modified land use practices • Various “best” management practices have been proposed. Little is known about their efficacy • How does one develop management/regulation plans for specific watersheds in this environment ? • Scale of watershed, location of source, Equity
The “Local” Decision Problem Collaborative Decision Making as a Watershed Management Approach - The Physical Scientists Role
TMDL: Total Maximum Daily Loads • Key aspects: • For each stream reach listed for a specific pollutant • Identify Beneficial Use • Identify Sources (point and non-point) & Background Loading • Allocate Loads to all Point and Non-Point Sources + Margin Of Safety • such that water quality standard(s) relative to beneficial use designation are met
Regulatory Constraints Management Goals Stakeholders Management Options Time Point & Time Frame Decision Human Activities Water Bodies Values of Activity Outcomes Eco-environmental State Natural Processes E.g. Climate, Geology Information Scale, Relevance, Availability, Source and Cost Natural State Desired State
Typical “Stakeholders” • Regional EPA Offices • State Departments of Environmental Quality, Water Rights, Fish and Wildlife, Natural Resources, Agriculture, Planning and Budget • The Western Governors Association (WGA) • Federal Land and Resource Managers – e.g., USFS, BLM, USBR, NPS, USFWS, NRCS, USDA, DOE, DOD • Association of County Governments and County Planners, Irrigation and Water Conservation Districts, Major Industries and Utilities • Environmental Organizations and Action Groups, Farm Groups • Information Suppliers: The scientific community - Universities and other Researchers
THE TMDL EQUATION as per EPA TMDL = Sum of WLA + Sum of LA + MOS • TMDL = WQ Standard for Beneficial Use Designation • WLA = Waste Load Allocation for each point source • NPDES Permits • LA = Load Allocation for each non-point source • BMPs • MOS = Margin of Safety (e.g. 20% of TMDL) • Socio-Economic Factors ? Uncertainty ? Variability ? Develop for each “reach”. Watershed Sequencing ? Trading ?
Current Modeling Approaches • Lumped, and spatially distributed simulation models for overland and channel flow generation given landscape information and climatic time series • Associated models for modeling the transport, reactions, decay and mixing of contaminants in a river channel and/or non-point source load generation • Lumped and spatially distributed discrete time simulation models for groundwater flow and transport and surface-water exchanges • "GIS Models" that use spatial landscape data and simple physics or statistical approaches to estimate mean fluxes at a point or perform discrete time simulations of the system given assumptions on exogenous climate and pollutant application • Statistical approaches based on linear or nonlinear (including neural network) regressions to provide estimates of the mean value (and variance) of loads and fluxes given specific indicators. • Statistical indicators of ecological condition of the watershed • Ecological models of habitat dynamics conditional on exogenous forcings • Statistical and dynamical models of economic markets and user preferences Focus on data and decision questions or on unit process modeling ? Do decision makers react to results of process simulations or to the chance of key outcomes ?
Approach • TMDL Management Plan = translate regulatory needs, competing stakeholder objectives into monitoring system design and watershed “operation” strategy given evolving data and goals • Focus on Variables/Processes needed for decision analysis and their interconnections - represent as a directed network • Recognize that unit process models provide means to connect variables on network • Explicitly consider role of natural variability and ignorance in defining uncertainty - Bayes network • Communication - Visualization / Presentation Tools • Simcity/Simearth motif with BayesNet providing SimRules • Limiting Probabilities vs Time Simulation ?
Margin of Safety - Some thoughts Example 1 point & 1 Non-point source Concern: Dissolved Oxygen Riparian Buffer Ranch Natural Area 1 Reach 1 Natural Area 2 Reach 2 Secondary Treatment Beet Factory Natural Area 3 MOS = TMDL - Total Loads FS = DOmean/TMDL Reach 3
DO pdf w/ Beet factory only DO pdf w/ Ranch only DOmean=6.6 FS=1.34 DO<TMDL 3.5% of time DOmean=7 FS=1.4 DO<TMDL 11% of time DO pdf w/ Beet factory + ranch DOmean=6.2 FS=1.24 DO<TMDL 23% of time The NPS (Ranch) has a higher FS than Beet Factory, but worse risk of violation of the standard For the case with both the beet factory and the ranch, we have a FS>1, but the TMDL is violated 23% of the time. Is this acceptable for ecological impacts ?
DO pdf w/ Beet treatment DO pdf w/ Riparian Buffer DOmean=7 FS=1. 4 DO<TMDL 12% of time DOmean=7 FS=1.4 DO<TMDL 5% of time DO pdf w/ Beet treatment + riparian buffer DOmean=7.2 FS=1.44 DO<TMDL 1% of time The 2 treatment options individually lead to the same FS, but the Riparian buffer leads to a lower risk of TMDL violation. Trading ? Is a 5% risk acceptable or do we need both options to reduce the risk to 1% ?
Setting up a Bayesian Network to Determine the Probabilities of Outcomes Example 1 point & 1 Non-point source Concern: Dissolved Oxygen Riparian Buffer Ranch Natural Area 1 Reach 1 Natural Area 2 Reach 2 Secondary Treatment Beet Factory Natural Area 3 Reach 3
Climate Conditions Economic Conditions Treatment Beet BOD NA2 BOD NA1 BOD R1 DO R3 DOcrit R2 DO Ranch BOD Riparian Buffer Costs and Benefits Network Diagram of Key Elements of the Physical System Bayes Network if “Local” Conditional Probability Distributions are defined for each Parent-Child Link set
Beet BOD R3 DOcrit Ranch BOD The Bayes Network can be reduced to focus on key items of interest Conditional Probabilities are evaluated from data or simulation models or can be specified by an expert
L ost Cr. Res. Stoddard Diversion East Canyon Cr. East Canyon Res. East Canyon Reservoir, UtahA case study Lost Cr. Echo Cr. Chalk Cr. Echo Res. Rockport Res. Silver Cr.
Concerns • Current problems • loss of cold water fisheries (stream and flat water) • reduction in use of State Park at East Canyon Reservoir • Annual Visitors (300K in 1986, now <100K) • periodic low dissolved oxygen in stream • eutrophication of reservoir • Future concerns • development - population to grow 400% in 20-30 years • conversion of agricultural to urban lands • interbasin water transfers that may reduce flushing
Goals • Control of Contaminant Discharges into East Canyon Cr. and Reservoir • Determination of total loading of a particular pollutant into a water body • point and non-point sources • overland flow • ground water • Need for discharge management to achieve water quality goals
Approach • Analysis of data • identification of data sources • U.S. EPA STORET repository, USGS repository, State of Utah, Results of university and other studies, data held by stakeholders • probability distributions for hydrologic, water quality, and contaminant source inputs • exploratory data analysis, parametric distribution fitting, non-parametric distribution ‘fitting’ • methods for finding probability distributions of outputs • Bayes nets, deterministic models
East Canyon Conceptualization East Canyon Reservoir Snyderville Basin WWTP Kimball Junction
Kimball Junction - Headwater TP Snyderville WWTP - Point Source Temp Temp TP Flow Flow East Canyon Creek East Canyon Reservoir
Models to route probabilities • Input Variables from Historical Data • QUAL2E/UNCAS - EPA developed and maintained • stream water quality and temperature • BOD/DO • nutrients • algae/Coliform bacteria • user-defined constituents • detailed representation of stream hydraulics • error propagation integral to model
Target Value Results - Reservoir Inflow
A future TMDL Strategy as a Bayes Net Stream flow Forecast Prior Water Quality Posterior Water Quality TreatmentCost Monitoring Cost Monitoring Strategy Treatment Strategy Net Benefit Total Cost Benefit
Questions Addressed • Where are the most erodible soils located within the watershed? • Where do the eroded materials move to; i.e., what stream segment? • What are the high priority areas to address erosion/ sedimentation for the watershed? • What stream segments are at greatest risk from sedimentation? • How would implementation of BMPs in selected areas of the watershed affect the erosion rate, mass, and loading into the receiving streams? • How is the amount of eroded material attenuated as it moves over and through different areas with varying land cover/use, soils, and slope?
30 m DEM based on USGS data River Reach Files SSURGO soils data (USDA-NRCS) GIS input data
Functional Elements of Computer Package • Database • Spatial, Environmental, Economic and Regulatory • Electronic Library • Case studies, beneficial uses, stakeholder information • Decision Process Guide • Walk through decision process, flag data, prescribe analyses • System Representation Tools • Physical representation of the landscape and control points, pollution sources and sinks • Process representation using Bayes networks • Analysis Tools • Statistical and Mechanistic Models
Using the System to Develop TMDLs • Project Setup • Identify sub-basin • Organize reaches by stream order • Determine listing status • Select pollutant for TMDL • Organize data sets • Sub-basin assessment • For each reach in sub-basin: • Determine beneficial use designation • Determine standards for selected pollutant • Identify sources • Characterize loads from each source • Generate probabilities from data • Identify management options • Evaluate management options • Information • Deterministic Models • Regional statistical analysis • Load allocation • Visualize system interconnections • Display causal network • Apply management options • Assess optimal economic load allocation strategy
A standalone Windows-PC application (no extra software required). Live links to local or Internet-based data sources, GIS capabilities and a guidance system that walks the user through the data analysis, modeling and decision-making processes. Project Environment
Internal Data Processing -Graphical Scripting A schematic-based data processing interface provides the user with an intuitive “drag and drop” ability to process and prepare both temporal and spatial data for use in the system.
External Data Processing-Regional Analysis Commercial GIS products such as ArcView are used to conduct a regional data analysis of all water quality stations in similar watersheds.
Regional Statistical Analysis A conditional probability table is generated from monitoring stations throughout the adjoining ecoregions. This table is used to provide estimates of nonpoint source loadings.