Download

1 / 46
460 likes | 589 Views
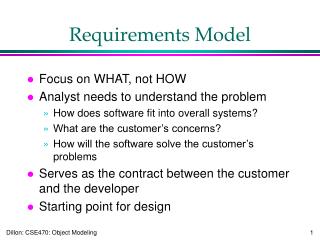
How the RPM Meets the Requirements for a Risk Model. Michael Schilmoeller Thursday , December 2, 2010 SAAC. Overview. Statistical distributions Estimating hourly cost and generation Application to limited-energy resources The price duration curve and the revenue curve Valuation costing

E N D
How the RPM Meets the Requirements for a Risk Model Michael Schilmoeller Thursday, December 2, 2010 SAAC
Overview • Statistical distributions • Estimating hourly cost and generation • Application to limited-energy resources • The price duration curve and the revenue curve • Valuation costing • An open-system models • Unit aggregation • Performance and precision
Statistical Distributions • Alternative strategies for speeding up calculation • More computer processing power • Previous presentation raises concerns about the limitations of this approach • Using selected hours of each week • A type of statistical sampling • Statistical distributions • Origins in older production cost models that used load duration curves Statistical distributions
Dispatchable Resources Statistical distributions
Estimating Energy Generation Price duration curve (PDC) Statistical distributions
Estimating Energy Generation Statistical distributions
Gross Value of Resources Statistical distributions
Gross Value of Resources Statistical distributions
Gross Value of Resources Using Statistical Parameters of Distributions Assumes: prices are lognormally distributed 1MW capacity No outages V Statistical distributions
Estimating Energy Generation Applied to equation (4), this gives us a closed-form evaluation of the capacity factor and energy. Statistical distributions
Variable Fuel Price • Assume lognormal distribution • Include information about price volatility and correlation with electricity price Statistical distributions
Implementation in the RPM • Distributions represent hourly prices for electricity and fuel over hydro year quarters, on- and off-peak • Sept-Nov, Dec-Feb, Mar-May, June-Aug • Conventional 6x16 definition • Use of “standard months” • Easily verified with chronological model • Execution time <30µsecs • 56 plants x 80 periods x 2 subperiods Statistical distributions
Application of PDC to Energy-Limited Resources Statistical distributions
Energy-Limited Dispatch Statistical distributions
Energy-Limited Dispatch Statistical distributions
Energy-Limited Dispatch • If pg* > pg then use energy and value associated with pg* • Otherwise, use energy and value associated with pg Statistical distributions
Application of Revenue Curve Equilibrium Prices Source: page 5, Figure 3, Q:\MS\Markets and Prices\Market Price Theory MJS\Price Relationships in Equilibrium2.doc Statistical distributions
Overview • Statistical distributions • Estimating hourly cost and generation • Application to limited-energy resources • The price duration curve and the revenue curve • Valuation costing • An open-system models • Unit aggregation • Performance and precision
Challenges Using Distributions Complications arise when we use extended time periods price Loads (solid) & resources (grayed) Valuation Costing
Challenges Using Distributions Average loads and resources are the same, but in the first case, our system has net cost and in the second it has net benefit. Valuation Costing
Traditional Costing Hourly variable cost calculation: Valuation Costing
Traditional Costing N*(N+1)/2 correlations (upper triangular matrix) Valuation Costing
Traditional Costing Valuation Costing
“Valuation” Costing Only correlations are now those with the market Valuation Costing
Valuation Costing • Solves the correlation problem by decoupling fuel price variation • We get the value term for dispatchable resources from the earlier calculation (V) • For wind and most renewables, the resource is non-patchable and correlation is fixed (we typically assume zero), which makes an easy calculation • For the pmQ term, hourly correlation of prices and load is important Valuation Costing
Overview • Statistical distributions • Estimating hourly cost and generation • Application to limited-energy resources • The price duration curve and the revenue curve • Valuation costing • An open-system models • Unit aggregation • Performance and precision
Closed-System Models Open-System Models
Open-System Models ? Open-System Models
Modeling Evolution • Problems with open-system production cost models • valuing imports and exports • desire to understand the implications of events outside the “bubble” • As computers became more powerful and less expensive, closed-system hourly models became more popular • better representation of operational costs and constraints (start-up, ramps, etc.) • more intuitive Open-System Models
Open Systems Models • The treatment of the Region as an island seems like a throw-back • We give up insight into how events and circumstances outside the region affect us • We give up some dynamic feedback • Open systems models, however, assist us to isolate the costs and risks of participant we call the “regional ratepayer” • Any risk model must be an open-system model Open-System Models
Relationship of electricity price to fuel price • In a closed model, there are no imports or exports • (Hourly) electricity price is entirely determined by the value of other variables, such as fuel price energy require- ments dispatch price market price for electricity fuel price energy generation Only one electricity price balances requirements and generation Open-System Models
Closed-system models • A closed system has by definition certain “constant” relationships, a preserved quantity such as energy • Introducing uncertainty means introducing additional variables εifor error or uncertain variation • Doing so creates an “over-specified” system which generally has no solution Open-System Models
Closed-system models • Consequently, when we introduce uncertainty into systems that are closed with respect to electrical energy, we are actually creating an open-system modelwith respect to total energy, and • There is a equal and opposite response among the variables we elect to make dependent, and • There is a “perfect correlation” among our “sources of uncertainty,” with unknown consequences. (CCCTs are always marginal.) Open-System Models
The New Open-System Model • If fuel price is the only “independent” variable, the assumed source of uncertainty, electricity price will move in perfect correlation • That is, outside influences drive the results • We are back to an open system energy require- ments dispatch price market • price +εi for electricity fuel price+εi energy generation Only one electricity price balances requirements and generation Open-System Models
The RPM Convention • Respect the first law of thermodynamics: energy generated and used must balance • The link to the outside world is import and export to areas outside the region • Import (export) is the “free variable” that permits the system to balance generation and accommodate all sources of uncertainty • We assure balance by controlling generation through electricity price. The model finds a suitable price by iteration. Open-System Models
Equilibrium search Open-System Models
Overview • Statistical distributions • Estimating hourly cost and generation • Application to limited-energy resources • The price duration curve and the revenue curve • Valuation costing • An open-system models • Unit aggregation • Performance and precision
Unit Aggregation • Forty-three dispatchable regional gas-fired generation units are aggregated by heat rate and variable operation cost • The following illustration assumes $4.00/MMBTU gas price for scaling Source: C:\Backups\Plan 6\Studies\Data Development\Resources\Existing Non-Hydro\100526 Update\Cluster_Chart_100528_183006.xls Unit Aggregation
Cluster Analysis Source: C:\Backups\Plan 6\Studies\Data Development\Resources\Existing Non-Hydro\100526 Update\R Agnes cluster analysis\Cluster Analysis on units.doc Unit Aggregation
Overview • Statistical distributions • Estimating hourly cost and generation • Application to limited-energy resources • The price duration curve and the revenue curve • Valuation costing • An open-system models • Unit aggregation • Performance and precision
Performance • The RPM performs a 20-year simulation of one plan under one future in 0.4 seconds • A server and nine worker computers provide “trivially parallel” processing on bundles of futures. A master unit summarizes and hosts the optimizer. • The distributed computation system completes simulations for one plan under the 750 futures in 30 seconds • Results for 3500 plans require about 29 hours Performance and Precision
Repeatability Over Futures Source: C:\Backups\Olivia\SAAC 2010\101202 SAAC First Meeting\Presentation materials\Reproducibility restored for illustration 101130.xls Performance and Precision
Precision Source: email from Schilmoeller, Michael, Monday, December 14, 2009 12:01 PM, to Power Planning Division, based on Q:\SixthPlan\AdminRecord\t6 Regional Portfolio Model\L812\Analysis of Optimization Run_L812.xls Performance and Precision
Model Resolution: At Least $10 million NPV • Typically, plans have over 70 of the 75 high-cost futures in common • The model results then come to resemble sensitivity analyses, rather than statistical sampling • Of course, we could not have anticipated this beforehand • The most interesting results occur when the high-cost futures differ Performance and Precision