Download
1 / 54
650 likes | 945 Views
Characterization of Geiger Mode Avalanche Photodiodes. Adam Para, Fermilab Trieste, June 3, 2008. Outline. Motivation and goals MPPC/SiPM/PPD : the Standard Model Samples and Measurements Comparison with the Standard Model Determination of the parameters of the Standard Model.

E N D
Characterization of Geiger Mode Avalanche Photodiodes Adam Para, Fermilab Trieste, June 3, 2008
Outline • Motivation and goals • MPPC/SiPM/PPD : the Standard Model • Samples and Measurements • Comparison with the Standard Model • Determination of the parameters of the Standard Model
Motivation • PPD is a novel kind of photodetectors offering new possibilities for the HEP detectors design. The most attractive/enabling features include: • Tiny size ( hermeticity!) • Immunity to magnetic fields • Resolution ( Calorimetry) • Fast Timing ( TOF) • Potential contribution of Fermilab: miniature and inexpensive readout ASIC
Goals • Understand the response of the detectors as a function of: • Operating conditions: • Bias voltage • Temperature • Light intensity • Temporal characteristics of the light input • Provide measurements of electrical characteristics of the detectors as an input for the ASIC design • Develop a procedure for the calibration of the response of the detectors: interpretation of the detector signals in terms of the incoming light intensity
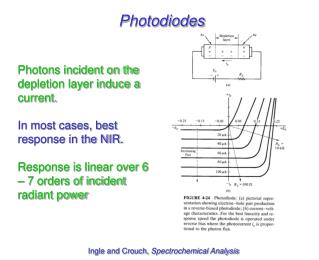
Photodiodes, Avalanche, Geiger Mode • Photodiodes: • p-n junction , reverse bias • Electron-hole pair generated by an incoming photon drifts to the edges of the depleted region • I(t) = QE * q * dNg/dt(t) • Absolute calibration • No gain • Suitable for large signals
Photodiodes, Avalanche, Geiger Mode • Avalanche Photodiodes: • Photodiodes operating at higher bias voltage • Higher voltage –> stronger electric field -> higher energy of drifting carriers -> impact ionization -> Gain • (Im)Balance between the number of carriers leaving the depletion region and the number generated carriers per unit time: dNleave/dt > dNgenerated/dt • Stochastic process: signal quenches when the ‘last’ electron/hole fails to ionize. • Large fluctuations of the multiplication process -> Gain fluctuations -> Excess noise factor (beyond-Poisson fluctuations)
Photodiodes, Avalanche, Geiger Mode • Geiger Mode Avalanche Photodiodes: • Avalanche Photodiodes operated at the elevated bias voltage. • Larger field -> carriers gain kinetic energy faster => shorter mean free path • Breakdown voltage: nothing really breaks down, but dNleave/dt = dNgenerated/dt (on average) at this voltage • Some electrons can generate self-sustaining avalanche (current limited eventually by the series resistance) • Probability of the avalanche generation increases with bias voltage (electric field) • Operation mode: one photon (sometimes) continuous current
GM APD Arrays: SiPM, MPPC, PPDCPTA,Hamamatsu, IRST, JINR, MEPhi, SensL
Challenges of Multipixel Devices • Edge effects: fill factor, effective quantum efficiency (PDE) • Premature Edge Breakdown -> guard rings, other local complications • Single pixel – standard response, Q=Cd*(Vbias-Vbd). Multiple pixels pixel-to-pixel uniformity? • Photon-mediated cross-talk: ~3 photons/105 electrons in the avalanche • Impact ionization requires high fields, often incompatible with standard processes • Dynamic range/linearity (number of pixels)
Categories of Observed Signals in Multipixel Devices • Single avalanches and afterpulses exist in single and multipixel detectors • Double signal are specific to multipixel detectors
Examples of Practical Questions • Which detector to use (ignoring details like price and current availability) ? Hamamatsu/CPTA/IRST/SensL? Does is matter? • What pixel size? 25/40/50/100 microns? How many pixels? • What bias voltage to use? • What temperature? • Need to stabilize temperature and voltage? Or is it sufficient to read them back? Or change voltage with the changes of temperature? • Need external calibration? Or is the single/nth pe peak sufficient to calibrate the gain? • How to do the large scale quality control? Is the static (DC current) measurement sufficient? • How long integration gate? How many time samples? In many instances the answer depends on the application. We are trying to collect data to serve as basis for such decisions.
Samples • We have samples of detectors from different sources. • The results shown here are obtained with the samples of Hamamatsu MPPC. Why Hamamatsu? • You have to start somewhere • These detectors come with detailed detector-by-detector characterization. Very helpful to establish credibility of measurements • We have samples of 25, 50 and 100 micron pixel devices. Comparison of their characteristics provides a good test of out Standard Model. Most of the detailed studies, so far, carried out for 25 micron devices. Why? • Most attractive for the calorimetric/pulse height measurement applications (dynamic range!) • Probably most challenging case
Static Measurements • Static characteristics - IV curves at fixed temperatures: • Keithley 2400 sourcemeter • Labview data acquisition program • Forward bias series (quenching) resistance • Reverse bias breakdown voltage, integral behavior of the detector s a function of the operating temperature • Room for improvement: Peltier cold plate – source of the electrical noise. Limiting factor at very low currents (~pA) for some detectors, preventing the measurements for others.
Forward Bias Scan Limited by quenching resistor dI/dV = 1/R Exponential growth with V Resistance decreases with temperature (polysilicone)
Reverse Bias Scan Breakdown Voltage Claudio Piemonte
Reverse Bias Scan Quenching resistance 1 V above breakdown I~5x10⁻⁷A Gain ~ 4x10⁶ ‘Photodiode’ current level ~ 10-13 A How relevant is the current below the breakdown voltage? Temperature 100 pA Breakdown Current below the breakdown Voltage increases with temperature (beware of condensation!)
Rates Measurement Setup: • Keithley 2400 source-meter • Amplifier MITEQ, 30 dB, 1000 MHz • HP5313A counter • Clipping cable 5 nsec (to reduce impact of afterpulsing) • Labview data acquisition Measure rates as a function of threshold (in the dark) Pulse height spectrum
First Peak: Single Avalanches Breakdown voltage from height vs V Width of single pe peak ~ 20 mV Electronics?? High pixel-to-pixel uniformity Width of single pevs V
Dark Pulses Rates 1 ‘p.e.’ 4 ‘p.e.’ 2 ‘p.e.’ 3 ‘p.e.’ Differentiate Define 1,2,3,4 ‘p.e.’ rate as a rate at 0.5, 1.5, 2.5, 3.5 of a single peak height
Dark Pulses Rates as a Function of Bias (Over)Voltage • Dark pulses rate grows ~exponentially with overvoltage • At the same overvoltage: • R(100)~ 3xR(50) ~ 9xR(25) • Not quite proportional to the active area.
Cross Talk Measurement Ratios of rates give relative probabilities of 1,2,3 extra pixels firing due to cross-talk Single avalanche rate Single + 1 cross talk Single +2 cross talk Single +3 cross talk
Cross Talk Rates as a Function of Bias Voltage • Cross talk probability increases with the bias voltage • Cross talk probability is bigger for larger size pixels • But… The cross talk is mediated by infrared photons produced in the avalanche, hence is ought to be proportional to the gain. And different size pixel detectors have different gain !
Cross Talk Probability as a Function of Gain • At the same gain the cross-talk probability is much larger for smaller size pixels • At the operating point the Hamamatsu detectors have very small cross talk (~few %)
Cross-talk Probability as a Function of Avalanches • Naïve expectations: • with two avalanches present the number of photons is doubled, hence the cross talk probability ought to be higher • Ditto for three avalanches present Naïve model doesn’t hold: some conspiracy between the solid angle and the photons mean free path??
Detector Response to Light Pulses • Light source: • Short pulse duration (<1 nsec) • 1060 nm infrared laser • ~3-4 photons detected • Readout strategy: • Trans-impedance amplifier ( MITEQ amplifiers: AU-2A-0150) • Tektronix 3054B digital scope • 4 msec trace acquired, laser pulse positioned at the center • LabView DAQ and analysis program • Root-based analysis environment • Most of the results shown for Hamamatsu 025U detector
Examples of Traces Instabilities (afterpulsing) induced by response to laser light Clustering of ‘dark’ pulses
Snapshot of Several Regimes at the Same Time • Acquire 4 msec long waveform with laser pulse positioned in the middle • -2.0 – 0 msec: ‘quiet state’ of the MPPC: • Dark rate • Gain • Cross talk, afterpulses • ‘Laser gate’: • Response to the light input • Cross talk • Afterpulses • ‘Post laser gate’ • Afterpulsing, recovery
‘Quiet Time’ – Thermal Electrons-Induced Avalanches? • Have N scope traces. Count the peaks found = M • ‘Raw’ dark rate = M/(N×Dt). But they should be uncorrelated Poisson distribution • P(0) = Nempty/N = exp(-Nave) • ‘True’ dark rate = Nave/Dt • ‘ ‘Raw’ – ‘True’ Rates = ‘Afterpulse’ (correlated) rate • Fraction of single pulses + Poisson statistics => another estimate of afterpulsing probability
Time Difference Between Dark Pulses Vbias =72.75 V Large number of pulses closely clustered in time • Fraction of traces with exactly one pulse: • Expected : 0.39 • Observed: 0.08
‘Dark’ Rates vs Voltage ‘Raw’ rate ‘True’ rate ‘True’ rate, single peak method (inferior) Probability that a single avalanche will induce at least one more avalanche (afterpulse) • Rate of ‘true’ dark counts increases slightly with bias voltage(reflecting the increase of the probability that a free electron will start an avalanche). This is expected as the rate of free carrier generation depends on the temperature and not the bias voltage. • Observed exponential growth of the dark rate is caused by afterpulsing • At the higher bias voltage ‘dark’ pulses come in clusters
Insights About the IV plot? Increase of gain x (mostly) increase of afterpulsing Afterpulsing probability ~ 1, run-away Break-down voltage of the detector
Single (Isolated) Dark Pulses: Self-Calibration of the Detector With longer gate or higher voltage a long tail (afterpulses) and a double avalanche peak (cross talk) appear
Dark Counts: Comment About the Rates • 71.5 V, integration gate of 50 nsec • Dark count rate: what is the reduction when cutting at 1.5 pe?? It depends on the definition of ‘rate’: • Factor of 30-50 (cross talk probability) if measure the amplitude, bias voltage dependent • Factor of 5-10 if measure integral within some gate (gate dependent), dominated by afterpusling
Laser Light Pulses • Fractional content of the ‘zero’ bin -> average number of photons detected • 3-5 photons detected • Good agreement between ‘charge’ and ‘amplitude’ –based measurement • An apparent increase of the laser intensity with the bias voltage is an indication of the increase of the PDE (avalanche initiation probability) by a factor of ~ 1.5 between 71 V and 72.75 V
Light-Induced vs Dark Pulses? • Single p.e. pulses before during and after the laser gate recorded at different bias voltages: • pulse shape does not depend on the avalanche origin • pulse shape does not depend on the voltage, apart from the overall factor (gain)
Gain/linearity at Low Light Levels • Integrate 1,2,3 avalanches peaks in 10 nsec gates (afterpulses vetoed) • Q(N) = NQ(1) • Q = C*(Vbias – Vbr) C = 12fF • Vbr = 68.5 V
Analysis of the ‘Laser Gate’ Data • Two possible measures of the signal/readout strategies: • the peak amplitude (peak sensing readout) • Practical for very short light pulses (lasers, Cherenkov) • Integrate the charge within some gate (30 nsec shown thereafter) • More typical case for HEP (like calorimetry) • Gate length? • Number of samples?
Reconstructing the Poisson Distribution (Charge and Amplitude)
Laser Pulses vs Bias Voltage: Amplitude Notice the decrease of the number of zero’s and the general shift to the right: increase of the mean number of detected photons as a result of the increase of detection efficiency with bias voltage. Consistent with the measurement using ‘zeros’.
Charge of the laser pulse in 30 nsec gate • With the increasing bias voltage afterpulses increase the response, but degrade the ability to detect individual avalanches. • Poisson shape destroyed • This is caused by additional pulses or parts of thereof sneaking into the integration gate.
Charge of the Laser pulse in 10 nsec gate with afterpulse veto • Require that [Q(30) Q(10)]<0.15xQ(10), i.e. no afterpulse immediately following the laser pulse. • Ability to count individual avalanches restored. • This is not a very practical solution in real life applications, though. It may be, perhaps, of some use in situations where: • Arrival time of the light pulse is known (timing of the gate) • Input light pulse has small duration (~ 1-2 nsec)
Output Pulse Shape as a Function of Bias Voltage • Average pulse shape of the response to the laser light as a function of the bias voltage (red – Vbias =71 V, blue – Vbias = 72.75 V) • Clear evidence for afterpulsing component growing with the voltage making pulses bigger and longer.
Variation of ‘observables’ with Bias Voltage • Different measures of the signal show different variation with the bias voltege (at fixed temperature and the same light signal). • For 1.5 V variation of the bias voltage the peak amplitude grows by a factor of about 2.5, whereas the integral of charge in 100 nsec gate changes by a factor of 7 • Need to keep the voltage (and temperature) very stable or need to devise a precise calibration procedure.
Choosing the Gate for the Readout? • Observed signal grows with the bias voltage. This growth has several components: • increase of the gain • increase of afterpulsing. • The latter is a much bigger effect. So what?? Afterpulses provide a kind of additional gain. True, but this contribution fluctuates degrades the charge measurement resolution (excess noise factor). • Relative width of the observed pulse height spectrum slightly decreases with bias voltage for 10 nsec gate (presumably a reflection of the increased number of detected photons), but it increases for longer gates. • Bottom plot shows a contribution to resolution from fluctuations of the afterpulses contribution in different gates.
Detector Recovery / Afterpulsing • Pulse arrival distribution: clear afterpulsing for about~ 1 msec • At least two components: • t1=39 nsec • t2=202 nsec • These components probably correspond to traps with different lifetimes
25/50/100 micron pixel devices: Capacitance From the gain vsVbias dependence