Download
1 / 23
230 likes | 321 Views
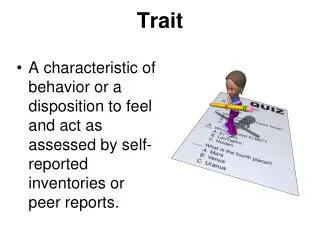
Hierarchical Structuring of Trait Data. Bot 940: Evidence for Evolution Eric Caldera. Scientific Method. Observation and description: Organisms seem to have changed over time Formulation of a Hypothesis: Evolution by decent with modification / common ancestry

E N D
Hierarchical Structuring of Trait Data Bot 940: Evidence for Evolution Eric Caldera
Scientific Method • Observation and description: Organisms seem to have changed over time • Formulation of a Hypothesis: Evolution by decent with modification / common ancestry • Predictions: Biological traits should appear in a nested hierarchical structure “groups within groups” • Experimental test of predictions: Do traits suspected to have arisen by decent with modification show a greater degree of hierarchical structure?
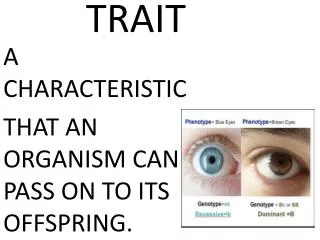
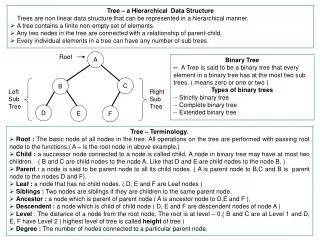
Vascular tissue Chloroplasts = shared-derived characters Water-tight egg Four limbs Nested hierarchical structure “groups within groups”
Vascular tissue Chloroplasts = shared-derived characters Water-tight egg eukaryote Four limbs Note that we don’t see overlap across groups Example: there are no fungi with vascular tissue, insects with four limbs or amphibians with vascular tissue…etc.
Why do we predict nested hierarchical structure? • Only branching evolutionary processes are capable of generating nested hierarchical structure. • For example, human languages, which have common ancestors and are derived by descent with modification, generally can be classified in objective nested hierarchies (Pei 1949; Ringe 1999).
Only certain things can be classified objectively in a consistent, unique nested hierarchy. • The difference drawn here is between "subjective" and "objective”. • Anything can be grouped into hierarchies (for example, automobiles), but the importance of characters must be weighted subjectively.
Subjective grouping of automobiles three wheels four wheels three wheels A B four wheels Characters four wheels Note that one tree is not more parsimonious over the other. In tree A, the number of wheels is subjectively weighted over color, and vice versa in tree B. three wheels red blue
A cladistic analysis of automobiles will not produce a unique, consistent, well-supported tree that displays nested hierarchies. • A cladistic analysis of automobiles (or any analysis of randomly assigned characters) will result in a phylogeny, but there will be a very large number of other phylogenies, many of them with very different topologies, that are as well-supported by the same data. • Cladistic analysis of an actual genealogical process will produce one or a small amount of trees that are much more well-supported by the data than the other possible trees.
The nested hierarchical organization contrasts with other possible biological patterns, such as the continuum of "the great chain of being"
Mere similarity between organisms is not enough to support evolution. • The nested classification pattern produced by a branching evolutionary process, such as common descent, is much more specific than simple similarity.
Is demonstrating that phylogenies show hierarchical structure enough? How much nested structuring is necessary to show that the structure is non-random? www.talkorigins.org
Testing for Hierarchical Structure • Plylogenetic signal (the degree to which a phylogeny shows a unique well supported tree) can be quantified. • We will discuss two methods: the randomization test and the consistency index (CI). (Archie, 1989; Klasssen et al. 1991) • For additional tests see: Faith and Cranston 1991; Farris, 1989, Felsenstein 1985; Hillis 1991; Hillis and Huelsenbeck 1992, Huelsenbeck et al. 2001
Archie, 1989 • Provides a test to determine whether the minimum length tree for a given dataset is significantly different from that expected from random data.
Archie’s Randomization test: • 1. randomize character data and perform the cladistic analysis • 2. repeat this process to obtain a distribution of the minimum tree lengths for the randomized data • 3. Test whether the minimum length tree generated from the real data is significantly smaller than the trees generated from randomized data
Real data Vascular tissue Chloroplasts Water-tight egg Four limbs Randomized data
Minimum length tree from real data Distribution of minimum length trees from randomized dataset
Min tree from real data Distribution of randomized data Archie, 1998
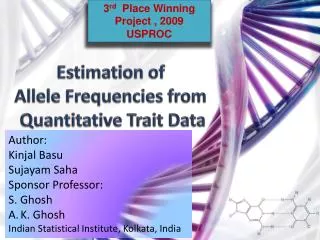
Klassen et al. 1991 • Makes use of the consistency index (CI) • CI represents the reciprocal of the number of steps per character • The further from one, and the closer to zero = increased homoplasy • A problem with CI is that is seems to decrease as a function of number of characters and taxa
Klassen et al generated CI distributions for random datasets of varying numbers of taxa and characters. • The CI values for random data can then be compared to real data
Note that most real datasets are well above the 95% confidence interval for CI values, and in no cases are they below the 95% limit. Klassen et al. 1991
Did GOD do it? • How might you respond to the idea that nested hierarchal structure is seen because certain traits, by design, work better together? • Is testing hierarchical structure against a “random” alternative sufficient. What about those that argue that god did not design things “randomly”
Archie, J. W. (1989) "A randomization test for phylogenetic information in systematic data." Systematic Zoology 38: 219-252. • Faith, D. P., and Cranston, P. S. (1991) "Could a cladogram this short have arisen by chance alone?: on permutation tests for cladistic structure." Cladistics 7: 1-28. • Farris, J. S. (1989) "The retention index and the rescaled consistency index." Cladistics 5:417-419. • Felsenstein, J. (1985) "Confidence limits on phylogenies: an approach using the bootstrap." Evolution 39: 783-791. • Hillis, D. M. (1991) "Discriminating between phylogenetic signal and random noise in DNA sequences." In Phylogenetic analysis of DNA sequences. pp. 278-294 M. M. Miyamoto and J. Cracraft, eds. New York: Oxford University Press. • Hillis, D. M., and Huelsenbeck, J. P. (1992) "Signal, noise, and reliability in molecular phylogenetic analyses." Journal of Heredity 83: 189- 195. • Hillis, D. M., Moritz, C. and Mable, B. K. Eds. (1996) Molecular systematics. Sunderland, MA: Sinauer Associates. • Klassen, G. J., Mooi, R. D., and Locke, A. (1991) "Consistency indices and random data." Syst. Zool. 40:446-457. • Pei, M. (1949) The Story of Language. Philadelphia: Lippincott. • Ringe, D. (1999) "Language classification: scientific and unscientific methods." in The Human Inheritance, ed. B. Sykes. Oxford: Oxford University Press, pp. 45-74.