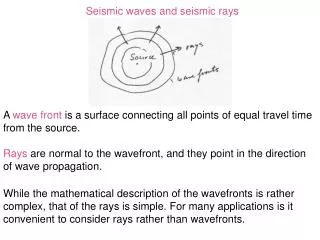
Download
1 / 28
280 likes | 874 Views
Geologic Structure and Seismic Analysis. Kentucky Geological Survey James A. Drahovzal, John B. Hickman and Paul D. Lake. Trenton Black-River Research Consortium September 9, 2004 Pittsburgh, PA. Structure and Seismic Analysis. Basement structure Map

E N D
Geologic Structureand Seismic Analysis Kentucky Geological Survey James A. Drahovzal, John B. Hickman and Paul D. Lake Trenton Black-River Research Consortium September 9, 2004 Pittsburgh, PA
Structure and Seismic Analysis • Basement structure • Map • Major structural features (esp. those affecting dolomitization) • Structure and isopach maps • Basal Sandstones (needed for dolomitization of T-BR?) • Knox Unconformity • Ordovician (top) • Trenton • Black River • Integration of gravity and magnetic data • Evaluate zones of potential hydrothermal dolomite development
Industry Partner Support: Seismic Data • All sponsors e-mailed February 2004 • Telephone contact with all except for one company • Face to face visits with the following: • Seneca Resources (Scott Gorham) • Seismic Exchange Inc. (Jeff Lester) • GeoData (Biff Rummerfield) • EXXON (Pinar Yilmaz) • Abarta Oil and Gas (Bernie Miller, representing Abarta) • North Coast Energy (David Cox) • Enervest (CGAS): 3-D data at Saybrook (Bill Grubaugh)
Industry Partner Support, cont. • Data in house from: • Seisco: covers KY, WV and parts of PA and NY • New York State Museum: SEI data covers W NY • Pennsylvania Survey data: part of western PA • North Coast Energy: covers small parts of WV (Evans and Paragon data) • USGS: part of Rome Trough Kentucky • Data Pending: • Petro Evaluation: part of Muskingum County, OH and possibly some other data • EXXON: seismic data proposal through GeoData • Abarta: part of Rome Trough Kentucky • Ohio Geological Survey: Class I-well areas of Ohio; COCORP
Current Seismic Data Available Blue – original Seisco digital data Red – new (since March) digital data Purple – new scanned paper data
Industry Partner Support, cont. • Concerns • SEI now is brokering most of the major’s seismic data and negotiations with them are difficult • Fear of confidentiality violation (3rd party consultants) • Fear of sharing even derivative data with other members of the consortium • Currently, focus on US; no overtures yet made to Ontario • Currently, focus on seismic data only; no gravity and magnetic data
For Discussion • Our ability to provide an adequate structural framework with the available data? • Especially for the deeper stratigraphic horizons • Basement • Basal sand • Additional seismic data from industry sponsors? • Gravity and magnetic data? • Integration • Industry sponsors • Availability of new well data/logs? • Newly drilled wells PA/NY
Newly Loaded Data • Eleven new analog (paper copies) of regional seismic lines have been scanned and loaded into PetraSeis™ software • Five new digital (SEG-Y) regional seismic lines from western New York state have been loaded into Kingdom Suite™ software • Nine new digital (SEG-Y) regional and field scale seismic lines from central West Virginia have been loaded into Kingdom Suite™ software, including 2-3 processed versions of each (enhanced stack, migrated, etc.)
Interpretation of Current Data • Ten regional seismic horizons interpreted for northeastern PA/southern NY region • Time to depth converted horizons gridded over PA/NY project area: • Tully Ls (Devonian) • Trenton Ls (Ordovician) • Precambrian metamorphic basement
Data Interpretation, cont. • Preliminary depth (feet) to Trenton Ls map for northeastern PA/southern NY • 16 stratigraphic horizons interpreted KY/OH/WV seismic lines • The interpretation of apparent basement offsets, along with other major faults is nearing completion (for the data presently collected by consortium).
Current Seismic Data Loaded Blue – original Seisco digital data Red – new (since March) digital data Purple – new scanned paper data
A A’ 0 sec. NY-PA 1 sec. 2 sec. 3 sec. B B’ NY-PA 0 sec. 1 sec. 2 sec. 3 sec. Seismic Interpretation A A B B’ A’ Paul Lake, 2004
Preliminary Tully Two-Way Time Structure Paul Lake, 2004
Preliminary Tully Two-Way Time Structure Paul Lake, 2004
Preliminary Trenton Two-Way Time Structure Paul Lake, 2004
Preliminary Trenton Two-Way Time Structure Depth Paul Lake, 2004
Preliminary Basement Structure Paul Lake, 2004
New Regional Velocity Model • Created to help determine the time-to-depth of seismic horizons, and to aid in stratigraphic correlation in areas of low resolution data • Formation tops from 763 wells, and sonic logs from 54 LAS files were used from the deep wells in OH, WV, and KY • Sonic log data averaged with petrophysical software (TerraStation™) within groups of strata resulted in precise internal velocities
Velocity Model, con’t. • Internal velocities of sixteen layers (groups of strata) corresponding to possible seismic horizons were “gridded” over KY/WV/OH project area, and edited for known fault trends • In wells without sonic logs, internal velocities were calculated by the creating sonic log grids. These grids that were used to determine time to formation tops. • A sixteen layer regional velocity model for the KY/OH/WV area, with an average error < 5%, based on well data
Kentucky/Ohio/West Virginia Velocity Model Maryville Ls to Rogersville Sh (middle Conasauga Gp) velocity “surface” Trenton to Black River velocity “surface” J. Hickman, 2004
Eastern KY Rome Trough Section N S J. Hickman, 2004
Northern Rome Trough Section, WV NW SE J. Hickman, 2004
Precambrian surface in OH, KY, and WV J. Hickman, 2004
J. Hickman, 2004 Paul Lake, 2004 Basement Structure
For Discussion • Our ability to provide an adequate structural framework with the available data? • Especially for the deeper stratigraphic horizons • Basement • Basal sand • Additional seismic data from industry sponsors? • Gravity and magnetic data? • Integration • Industry sponsors • Availability of new well data/logs? • Newly drilled wells PA/NY
Tectonic Dolomitization, Rough Creek Fault Zone Ohio and Grayson Counties, Ky. OHIO Sebree Trough GRAYSON D. C. Harris, 2004
Note tight dolomite in Black River interval in center 4 wells. Conoco wells on ends are undolomitized. D. C. Harris, 2004