Download
1 / 160
1.6k likes | 1.84k Views
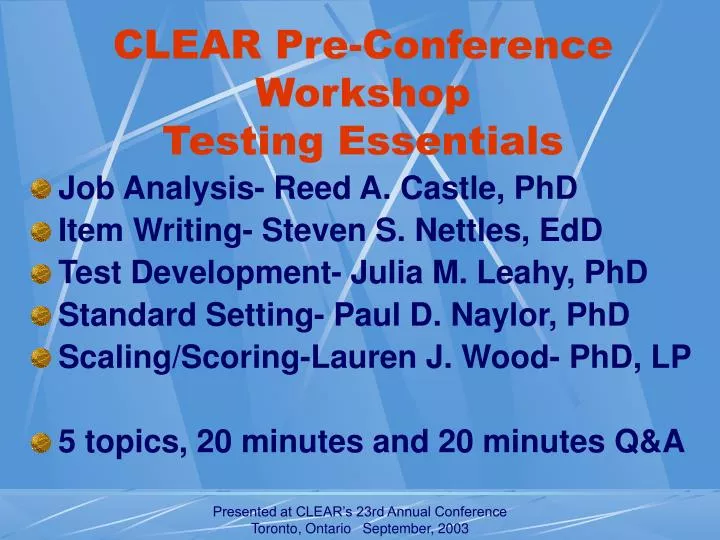
CLEAR Pre-Conference Workshop Testing Essentials. Job Analysis- Reed A. Castle, PhD Item Writing- Steven S. Nettles, EdD Test Development- Julia M. Leahy, PhD Standard Setting- Paul D. Naylor, PhD Scaling/Scoring-Lauren J. Wood- PhD, LP 5 topics, 20 minutes and 20 minutes Q&A.

E N D
CLEAR Pre-Conference WorkshopTesting Essentials • Job Analysis- Reed A. Castle, PhD • Item Writing- Steven S. Nettles, EdD • Test Development- Julia M. Leahy, PhD • Standard Setting- Paul D. Naylor, PhD • Scaling/Scoring-Lauren J. Wood- PhD, LP • 5 topics, 20 minutes and 20 minutes Q&A Presented at CLEAR’s 23rd Annual Conference Toronto, Ontario September, 2003
Job Analysis Reed A. Castle, Ph.D. Schroeder Measurement Technologies, Inc. Presented at CLEAR’s 23rd Annual Conference Toronto, Ontario September, 2003
What is a Job Analysis? • An investigation of the ability requirements that go with a particular job (Credentialing Exam Context). • It is the study that helps establish a link between test scores and the content of the profession. • The Joint Technical Standards14.14 • “The content domain to be covered by a credentialing test should be defined clearly and justified in terms of importance of the content for the credential-worthy performance in an occupation or profession. A rationale should be provided to support a claim that the knowledge or skills being assessed are required for credential-worthy performance in an occupation and are consistent with the purpose for which the licensing or certification program was instituted.” Presented at CLEAR’s 23rd Annual Conference Toronto, Ontario September, 2003
Why Conduct a Job Analysis? • Need to establish a validity link. • Need to articulate a rationale for examination content. • Need to reduce the threat of legal challenges. • Need to determine what is relatively important practice. • Need to understand the profession before we assess it. Presented at CLEAR’s 23rd Annual Conference Toronto, Ontario September, 2003
Types of Job Analyses • Focus Group • Traditional Survey-Based • Electronic Survey-Based • Transportability Presented at CLEAR’s 23rd Annual Conference Toronto, Ontario September, 2003
Focus Group • Need to Identify the best group of SMEs possible • Areas of Practice • Geographic representation • Demographically Balanced • 8 to 12 Presented at CLEAR’s 23rd Annual Conference Toronto, Ontario September, 2003
Focus Group • Prior to Meeting- • Comprehensive review of profession • Job Descriptions • Performance Appraisals • Curriculum • Other job-related documents • Create a Master Task List • Send list to SMEs prior to meeting to give them chance to review Presented at CLEAR’s 23rd Annual Conference Toronto, Ontario September, 2003
Focus Group • At Meeting- • Review Comprehensive Task List • Determine which tasks are important • Determine which tasks are performed with an appropriate level of frequency • Determine which tasks are duplicative • Identify and add missing tasks • Organize into coherent outline Presented at CLEAR’s 23rd Annual Conference Toronto, Ontario September, 2003
Focus Group • Advantages- • May be only solution for new/emerging professions • Relatively quick • Less expensive Presented at CLEAR’s 23rd Annual Conference Toronto, Ontario September, 2003
Focus Group • Disadvantages • Based on one group (Results may not generalize) • May be considered a weaker model when considering validation. • May result in complaints from constituents about the content of the test. Presented at CLEAR’s 23rd Annual Conference Toronto, Ontario September, 2003
Traditional Survey-Based • First steps are similar to the focus group (i.e., task list is generated in same manner) • After the task list is created, three more issues must be addressed to complete the first survey development meeting. Presented at CLEAR’s 23rd Annual Conference Toronto, Ontario September, 2003
Traditional Survey-Based • First, demographic questions must be developed with two goals in mind. • Questions should help describe the sample of respondents • Some Question will be used for analyses help generalize across groups (e.g., geographic regions) Presented at CLEAR’s 23rd Annual Conference Toronto, Ontario September, 2003
Traditional Survey-Based • Second, rating scale(s) should be developed. • Minimally, two pieces of information should be collected • Importance or significance • Frequency of performance • Additional scales can be added but may take away from response rate. • Shorter is sometimes better. Presented at CLEAR’s 23rd Annual Conference Toronto, Ontario September, 2003
Traditional Survey-Based • Sample Scale combining Importance and Frequency • High correlation b/w Freq and Imp Ratings (.95 and higher) • Considering both the importance and frequency, how important is this task in relation to the safe, effective, and competent performance of a Testing Professional? If you believe the task is never performed by a Testing Professional, please select the 'Not performed' rating. • 0 = Not performed • 1 = Minimal importance • 2 = Below average or low importance • 3 = Average or medium importance • 4 = Above average or high importance • 5 = Extreme or critical importance Presented at CLEAR’s 23rd Annual Conference Toronto, Ontario September, 2003
Traditional Survey-Based • Sampling- • One of the more important considerations is the sampling model employed. • Surveys should be distributed to a sample that is reflective of the entire population. • Demographic questions help describe the sample. • One should anticipate a low response rate (20%) when planning for an appropriate number of responses. Presented at CLEAR’s 23rd Annual Conference Toronto, Ontario September, 2003
Traditional Survey-Based • Mailing Surveys • Enclose a postage paid return envelope. • Plan well in advance for international mailings (can be logistically painful with different countries). • When bulk mailed, plan extra time. • Keep daily track of return volume. Presented at CLEAR’s 23rd Annual Conference Toronto, Ontario September, 2003
Electronic Survey-Based • Identical to traditional, but delivery and return are different. • Need Email addresses. • Need profession with ready access to Internet. Presented at CLEAR’s 23rd Annual Conference Toronto, Ontario September, 2003
Electronic Survey-Based • Advantages • Faster response time. • Data entry is no longer needed. • Reduced processing time on R & D side. • Possibly less expense (less admin costs). • Can modify sampling and survey on the fly if needed • Sample can be the population with little additional cost. Presented at CLEAR’s 23rd Annual Conference Toronto, Ontario September, 2003
Electronic Survey-Based • Disadvantages • Need Email addresses • High rate of “bounce-back” • Control for ballot stuffing • Data compatibility Presented at CLEAR’s 23rd Annual Conference Toronto, Ontario September, 2003
Transportability • Using the results of other job analysis • Determine compatibility or transportability • Similar to Focus Group Presented at CLEAR’s 23rd Annual Conference Toronto, Ontario September, 2003
Four Types Review • Focus Group • Traditional Survey-Based • Electronic Survey-Based • Transportability Presented at CLEAR’s 23rd Annual Conference Toronto, Ontario September, 2003
Demographics Importance Ratings Frequency Ratings Composite Sub group Analyses Decision Rules Reliability Raters Instrument Survey Adequacy Data Presented at CLEAR’s 23rd Annual Conference Toronto, Ontario September, 2003
Primary Demographics • Geographic Region • Years Experience • Work Setting • Position Role/Function • Percent Time in certain activities Presented at CLEAR’s 23rd Annual Conference Toronto, Ontario September, 2003
Mean Importance Ratings- 3.0 criterion Out In Presented at CLEAR’s 23rd Annual Conference Toronto, Ontario September, 2003
% Not Performed Ratings, Criterion 25% (75% perform) Presented at CLEAR’s 23rd Annual Conference Toronto, Ontario September, 2003
Composite Ratings • Composite ratings using rating scale Natural Logs (when multiple scales are used) can be calculated and combined based on some weighting scheme. • For example, if you want to weight frequency 33.33% and importance 66.66%, you can adjust for this in the composite rating equation. • Personal opinion is that you will likely end up in a very similar place if establishing decision criteria on each scale individually. • In addition, multiple decision rules is more conservative Presented at CLEAR’s 23rd Annual Conference Toronto, Ontario September, 2003
Mean Importance Sub-group Analyses Presented at CLEAR’s 23rd Annual Conference Toronto, Ontario September, 2003
Assessment Type • SMEs are asked to determine which assessment type will best measure a given task • Multiple choice • Performance • Essay/short answer Presented at CLEAR’s 23rd Annual Conference Toronto, Ontario September, 2003
Cognitive Levels • Each task on the content outline requires some level of cognition to perform • 3 basic levels exist (from Bloom’s Taxonomy) • Knowledge/Recall • Application • Analysis • Steve will discuss in next presentation Presented at CLEAR’s 23rd Annual Conference Toronto, Ontario September, 2003
Cognitive Levels • Of the remaining tasks-post inclusion decision criteria, SMEs are asked to rate them on a 3 point scale • For each major content area, an average rating is calculated • The average is applied to specific criteria to determine the number of items by cognitive level for each content area Presented at CLEAR’s 23rd Annual Conference Toronto, Ontario September, 2003
Weighting is usually done with SME’s based on some type of data For example, average importance or composite rating for a given content area Applied to assessment type and cognitive levels. Weighting Presented at CLEAR’s 23rd Annual Conference Toronto, Ontario September, 2003
Standard Exclusion/Inclusion criteria Test Specifications Assessment type/Cognitive levels Weights based on rational approach Reflect test-type Statistical Consensus Test Specifications/Weights Presented at CLEAR’s 23rd Annual Conference Toronto, Ontario September, 2003
Item Writing Steven S. Nettles, EdD Applied Measurement Professionals, Inc. Presented at CLEAR’s 23rd Annual Conference Toronto, Ontario September, 2003
Overview of Measurement • Job Analysis • Test Specifications • Detailed Content Outline • Item Writing • Examination Development • Standard Setting • Administration and Scoring Presented at CLEAR’s 23rd Annual Conference Toronto, Ontario September, 2003
Test Specifications & Detailed Content Outline • Developed based on the judgment of an advisory committee as they interpreted job analysis results from many respondents. • Guides item writing and examination development. • Provides information to candidates. • Required! Presented at CLEAR’s 23rd Annual Conference Toronto, Ontario September, 2003
Certified Item Writing Workshop Goals • appropriate item content and cognitive complexity • consistent style and format • efficient examination committee work Presented at CLEAR’s 23rd Annual Conference Toronto, Ontario September, 2003
A test item • measures one unit of content. • contains a stimulus (the question). • prescribes a particular response form. • The response allows an inference about candidates’ abilities on the specific bit of content. • When items are linked to job content, summing all correct item responses allows broader inferences about candidates’ abilities to do a job. Presented at CLEAR’s 23rd Annual Conference Toronto, Ontario September, 2003
Preparing to Write • Each item must be linked to the prescribed • part of the Detailed Content Outline. • cognitive level (optional). • Write multiple-choice items. • Three options better for similar ability groups. • Five options better for diverse groups. Presented at CLEAR’s 23rd Annual Conference Toronto, Ontario September, 2003
Why multiple choice? • Dichotomous (right/wrong) scoring encourages measurement precision. • Validity is strongly supported because each item measures one specific bit of content. • Many items sample the entire content area. • The flexible format allows measurement of a variety of objectives. • Examinees cannot bluff their way to receiving credit (although they can correctly guess). • We will talk more about minimizing effective guessing. Presented at CLEAR’s 23rd Annual Conference Toronto, Ontario September, 2003
Item components include • stem. • three to four options. • one key • two to three distractors. Presented at CLEAR’s 23rd Annual Conference Toronto, Ontario September, 2003
Item Components • Stem • The statement or question to which candidates respond. • The stem can also include a chart, table, or graphic. • The stem should clearly present one problem or idea. Presented at CLEAR’s 23rd Annual Conference Toronto, Ontario September, 2003
Example Stems • Direct question • Which of the following best describes the primary purpose of the Code of Federal Regulations? • Incomplete statement • The primary purpose of the CFR includes New writers tend to write clearer direct questions. If you are new to item writing, it may be best to concentrate on that type. Presented at CLEAR’s 23rd Annual Conference Toronto, Ontario September, 2003
Among the options will be the • key • With a positively worded stem, the key is the best or most appropriate of the available stem responses. • With a negatively worded stem, the key is the least appropriate or worst of the available stem responses. • Negatively written items are not encouraged! • distractors - plausible yet incorrect responses to the stem Presented at CLEAR’s 23rd Annual Conference Toronto, Ontario September, 2003
Cognitive levels • Recall • Application • Analysis Cognitive levels are designated because we recognize that varying dimensions of the job require varying levels of cognition. By linking items to cognitive levels, a test better represents the job, i.e., is more job-related. Presented at CLEAR’s 23rd Annual Conference Toronto, Ontario September, 2003
Cognitive levels • Recall items • use an effort of rote memorization. • are NEVER situationally dependent. • have options that frequently start with nouns. Presented at CLEAR’s 23rd Annual Conference Toronto, Ontario September, 2003
Recall item Which of the following beers is brewed in St. John’s? A. LaBlatts B. Molson C. Moosehead Presented at CLEAR’s 23rd Annual Conference Toronto, Ontario September, 2003
Cognitive levels • Application items • use interpretation, classification, translation, or recognition of elements and relationships • Any item involving manipulations of formulas, no matter how simple, are application level. • Items using graphics or data tables will be at least at the application level. • have keys that depend on the situation presented in the stem • If the key would be correct in any situation, then the item is probably just a dressed up recall item. • have options that frequently start with verbs. Presented at CLEAR’s 23rd Annual Conference Toronto, Ontario September, 2003
Application item Which of the following is the best approach when trout-fishing in the Canadian Rockies? A. Use a fly fishing system with a small insect lure. B. Use a spinning system with a medium Mepps lure. C. Use a bait casting system with a large nightcrawler. Presented at CLEAR’s 23rd Annual Conference Toronto, Ontario September, 2003
Cognitive levels • Analysis items • use information synthesis, problem solving, and evaluation of the best response. • require candidates to find the problem from clues and act toward resolution. • have options that frequently start with verbs. Presented at CLEAR’s 23rd Annual Conference Toronto, Ontario September, 2003
Analysis item Total parenteral nutrition (TPN) is initiated in a non-diabetic patient at a rate of 42 ml/hour. On the second day of therapy, serum and urine electrolytes are normal, urine glucose level is 3% and urine output exceeds parenteral intake. Which of the following is the MOST likely cause of these findings? A. The patient has developed an acute glucose tolerance. B. The patient’s renal threshold for glucose has been exceeded. C. The patient is now a Type 2 diabetic requiring supplemental insulin. Presented at CLEAR’s 23rd Annual Conference Toronto, Ontario September, 2003