Download
1 / 34
340 likes | 446 Views
Air Quality Effects of Prescribed Fires Simulated with CMAQ. Yongqiang Liu, Gary Achtemeier, and Scott Goodrick Forestry Sciences Laboratory, 320 Green St., Athens, GA. Third Annual CMAS Models-3 Conference Chapel Hill, October 18-20, 2004. Outline. Background

E N D
Air Quality Effects of Prescribed Fires Simulated with CMAQ Yongqiang Liu, Gary Achtemeier, and Scott Goodrick Forestry Sciences Laboratory, 320 Green St., Athens, GA Third Annual CMAS Models-3 Conference Chapel Hill, October 18-20, 2004
Outline • Background • SHRMC-4S: A framework for smoke/air quality simulation • Daysmoke: A model for fire plume rise • Case simulation of CMAQ with Daysmoke
Fire and Air Quality • Emission of smoke particles and gases -PM, CO, SO2, NOx, VOC • Degradation of air quality -PM2.5, smog, regional haze
SHRMC-4S(Southern High-Resolution Modeling Consortium-Southern Smoke Simulation System) • A research tool for investigating air quality effects of wildland fires, especially prescribed burning in the South • Assisting fire and smoke managers and policy makers in meeting air quality regulations and developing implementation plans
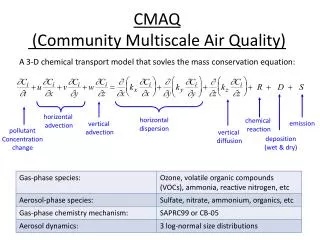
Fuel Load Fire Data Emissions Calculation Emissions Calculation Fire Behavior Emissions Output (hourly Emissions, phase, area, vertical velocity and dT) Weather Data SMOKE Fuel Consumption CMAQ Emission Factors Visualization Plume Parameters Hourly Emissions
Daysmoke as a Smoke Injector for CMAQ • Smoke plume rise • Vertical distribution
Daysmoke Components • Entraining turret plume model • Detraining particle transport model • Large eddy parameterization • Vertical profile specification
The turrets sweep out a 3-D path that defines the plume boundary. Plume boundary Plume boundary
Particle movement within the plume is described by • horizontal & vertical wind velocity within the plume, • turbulent horizontal and vertical velocity within the plume, • particle terminal velocity.
Detrainment occurs when • Stochastic plume turbulence places particles beyond plume boundaries • Plume rise rate falls below a threshold vertical velocity • Absolute value of Large Eddy velocity exceeds plume rise rate
Large eddy parameterization • Eddy size and strength are proportional to depth of PBL. • Eddy growth and dissipation are time-dependent • Eddies are transported by the mean wind in the PBL.
Constructing Vertical Plume Profiles “Wall” carries particle counters as function of height 3 miles Group the particles by CMAQ sigma level and insert into CMAQ each hour.
Running CMAQ with Daysmoke Plume Profiles • Florida • March 6, 2002 • 12 km resolution • 21 layers • Plume rise is estimated using -Daysmoke -Briggs scheme
Vertical distribution of smoke particles estimated using Daysmoke. (Average over all fires in FL on 3/6/2002)
Normalized vertical distribution of smoke particles estimated using Daysmoke (pink) and Briggs scheme (green). (Average over all fires in FL on 3/6/2002)
CMAQ simulation of PM2.5 concentration with plume rise estimated using DAYSMOKE (top) and Briggs scheme (bottom) (σ=1.0; t=2pm; d=3/6/2002)
CMAQ simulation of PM2.5 concentration with plume rise estimated using DAYSMOKE (top) and Briggs scheme (bottom) (σ=0.91(~1000 m); t=2pm; d=3/6/2002)
CMAQ simulation of PM2.5 concentration with plume rise estimated using Daysmoke (pink) and Briggs scheme (green). (Average over the northwestern FL on 3/6/2002)
CMAQ simulation of O3 concentration with plume rise estimated using DAYSMOKE (top) and Briggs scheme (bottom) (σ=1.0; t=3pm; d=3/6/2002)
CMAQ simulation of O3 concentration with plume rise estimated using DAYSMOKE (top) and Briggs scheme (bottom) (σ=0.91; t=3pm; d=3/6/2002)
CMAQ simulation of O3 concentration with plume rise estimated using Daysmoke (pink) and Briggs scheme (green). (Average over the northwestern FL on 3/6/2002)
Concluding Remarks • CMAQ with DAYSMOKE would produce more particles near the ground • This study represents the first run with Daysmoke connected with CMAQ. • Daysmoke validation: • 3mm radar observations of prescribed burn plumes scheduled for 2005 at Savannah River Forest • Comparisons with WRF simulations of smoke plumes • Matching with aerial photographs of smoke plumes