Download
1 / 13
130 likes | 221 Views
Laboratory 1. A simple Pitch tuner. Objectives. To lean how to interface analogue signals to digital systems To learn how to process audio signals in embedded systems. Aim To develop a pitch tuner using an embedded system. Signal processing steps. Capture signal by microphone

E N D
Laboratory 1 A simple Pitch tuner Lab 1: pitch tuner (v.9a)
Objectives • To lean how to interface analogue signals to digital systems • To learn how to process audio signals in embedded systems. • Aim • To develop a pitch tuner using an embedded system. Lab 1: pitch tuner (v.9a)
Signal processing steps • Capture signal by microphone • Amplify the signal • Feed to ADC of AMR7 micro. • Convert to digital , find autocorrelation coeff. • Find pitch Lab 1: pitch tuner (v.9a)
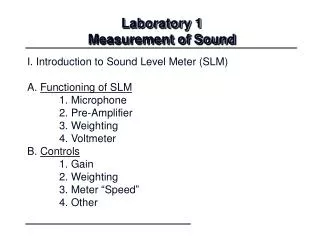
Hardware system RS232 Mic amp ADC input ARM7 PC for display result Mic Lab 1: pitch tuner (v.9a)
Amplifier • What is the best bias voltage at pin3(non-invert. input) ? • Condenser MIC output impedance is 75 Ohms, why this circuit is not a good design. How to correct it? • Hint: Input=1KHZ, find impedance of C1 and input of the amp. • Solution: C1>1uF, R2=1K, V3 = 100K(VR), use , one VR to replace VR1,2. Discuss why? Lab 1: pitch tuner (v.9a)
Software: Algorithm to find period=1/frequency Lab 1: pitch tuner (v.9a)
Auto-correlation to find rj=0, rj=1, rj=2,… • The signal is s0,s1,..,s511 • Example: j=time lag • Auto-correlation coefficients rj={ r0, r1,.., rn=8, …} are: Lab 1: pitch tuner (v.9a)
Matlab example 1 • a=[1 3 9 3 2 3 8 3 2 ], • r=(xcorr(a)) ,round (r) • R=r(j=time lag) • r=[ 2 9 35 60 96 72 86 123 190 123 86 72 96 60 35 9 17 2] • Exercise • Verify by hand the first 3 (r [ j ]) elements after the signal overlapped with itself. Lab 1: pitch tuner (v.9a)
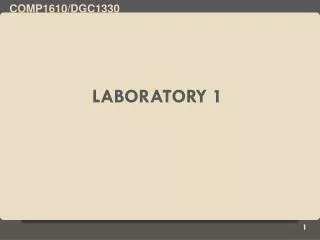
Matlab Example1:a=[1 3 9 3 2 3 8 3 2 ],r=(xcorr(a)) figure(1),clf,subplot(2,1,1)plot(a),subplot(2,1,2)plot(r) Data (a) Period=4, Pick 2 peaks and measure period Auto Corr. Xcorr (r) The middle is the peak Lab 1: pitch tuner (v.9a)
Since correlation is mirrored at the lag time (j=0) when the signal overlapped with itself • Only positive time lag is considered • Fundamental Period=j2 Auto correlation R(j) Rthe_max (j1) Rsecond_max (j2) Lag Time j in samples j2 j1=0 Lab 1: pitch tuner (v.9a)
Matlab Example2:y=sin wave of 440 Hz • dt=0.0001 • time=[0:dt:2] • freq=440 • nu=2.0*pi*freq • y=sin(nu*time) %angular freq. (sin wave of 440 Hz) • r=(xcorr(y)) • figure(2) , clf, subplot(2,1,1), plot(time,y) • axis ([0 0.01 -1 1]) • subplot(2,1,2), plot(time(1:100),r(1:100)) Lab 1: pitch tuner (v.9a)
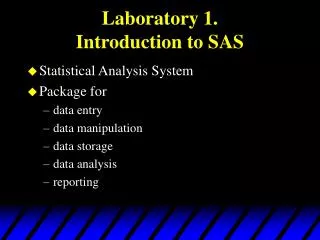
Matlab Example2:In fact any two peaks will give you the answersine wave of 440 Hz,period=0.0091-0.0068 (by inspection between 2 peaks)freq=1/period=434.7Hz input Data (y) Auto Corr. (r) 0.0068 0.0091 Lab 1: pitch tuner (v.9a)
Conclusion • Studied a method of measuring the pitch of an audio sound. Lab 1: pitch tuner (v.9a)