Download
1 / 17
170 likes | 292 Views
ANNEX A - CQC Performance, April – June, Quarter 1, 2012. Public Agenda item: 9 Paper no: CM/03/12/06. Contents Section 1 – Performance dashboard Slide 2 Section 2 – delivery priority 1: Deliver and Improve our regulatory and other functions Slides 3 - 8

E N D
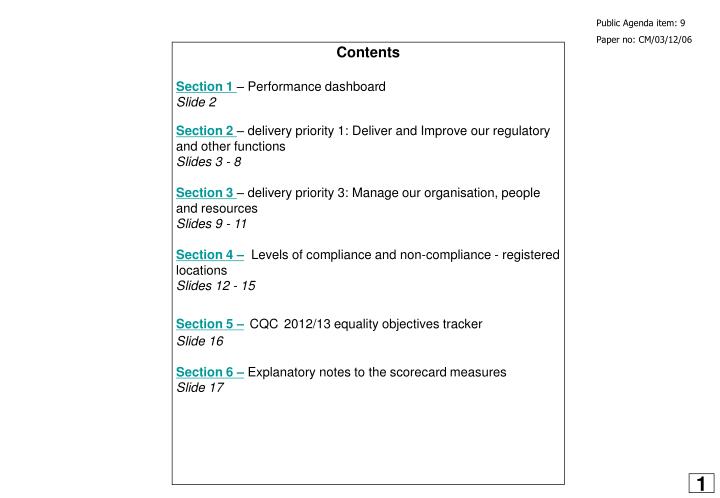
ANNEX A - CQC Performance, April – June, Quarter 1, 2012 Public Agenda item: 9 Paper no: CM/03/12/06 Contents Section 1– Performance dashboard Slide 2 Section 2– delivery priority 1: Deliver and Improve our regulatory and other functions Slides 3 - 8 Section 3– delivery priority 3: Manage our organisation, people and resources Slides 9 - 11 Section 4–Levels of compliance and non-compliance - registered locations Slides 12 - 15 Section 5 –CQC2012/13 equality objectives tracker Slide 16 Section 6 –Explanatory notes to the scorecard measures Slide 17 1
CQC Performance – April - June, Quarter 1 2012 – section 1, Performance dashboard 1. Operating Performance Performance dashboard Highlights and issues: Table 1: Operating Performance. NHS, ASC, IHC Private Ambulance and Dentist compliance inspections are below planned activity required to achieve full year targets however activity has increased in the period and improved in some areas in July (see slide 3) Table 2: Public facing and governance measures - with the exception of complaints handled within 20 days, all targets were achieved. There were almost 10% less complaints than the same period last year and handling of statutory requests for information remains strong. Stage 2 complaints within 20 days have remained red for the second month, it should be noted that these figures are based on low numbers, there have been only 25 stage 2 in the quarter, those missing the target are largely due to complex complaints, although at the end of the quarter all had been cleared. All NCSC targets were achieved in the period and continue to perform strongly. NCSC information is available on slide 6 and complaints and other information requests is on slide 11. Table 3 shows the Q1 snapshot of compliance levels across each sector, for locations additional information and a breakdown is available slides 12 to 15. Table 4: YTD the Commission has under spent by £3.1m (excluding fee income)– further details are on slides 10. Indicators that are also included in our ‘Public scorecard’ on our website are highlighted across the report in yellow and where applicable a post period update has been added to include the most recent performance information. Please note ‘trend’ performance is based on improvement in the 3 months of the quarter, not compared with Q4. 3. Current level of compliance (locations) Graph 1 demonstrates the percentage of inspections completed by sector in Q1 and the relevant Q1 profiled target is given by the line: 2. Public facing and governance 4. Resources 2
CQC Performance – April - June, Q1, 2012– section 2, Deliver and Improve our regulatory and other functions Priority 1 – Deliver and improve our regulatory and other functions: Strengthen and improve the effectiveness and consistency of the regulatory model – Compliance, Enforcement and Registration Overall inspection performance remains below planned activity but improving. 22% of NHS inspections were completed in Q1, marginally below plan.ASC inspections increased each month in Q1 (see graph below) and achieved 94% of target in the period. There was an increase in dentist inspections to achieve 83% of target and although below plan IHC inspection figures improved significantly; there were 117 IHC inspections in April compared with 68 in May and 60 in April. Inspection activity is forecast to accelerate in Q2 as new Inspectors come on stream, however, based on Q1 performance annual targets will remain challenging. Post period update: As of the end of July: NHS: 25% (89) completed against a target of 25% (89) ASC: 25% (6,307) completed against a target of 24% (6,025) IHC: 12% (232) completed against a target of 22% (575) Dentists: 18% (644) completed against a target of 22% (764) Ambulance: 7% (15) completed against a target of 17% (55) Thematic reviews are currently paused whilst a new governance process for approving new thematic review proposals is considered. It is anticipated that the thematic review programme will recommence in Q3. In Q1, 67.7% of final compliance reports were issued within 25 days compared with a target of 90%. This indicator is more challenging than last year and has continued to improve, it also compares favourably to the same period last year when 36.3% where issued with 28 days. Performance is being reviewed by Operations and an action plan being put in place, CRM improvements due in August are expected to considerably improve performance of this and the draft report (C11) indicator. Post period update: as of the July performance report 63% of draft reports and 68% of final reports were issued against a plan of 90%. 1 This is the profiled target to date the annual target is given numerically in the cells to the left 2 This is the latest figure in respect of June, no Q1 figure has been reported but will be available for the next report 3
CQC Performance – April - June, Q1, 2012– section 2, Deliver and Improve our regulatory and other functions Priority 1 – Deliver and improve our regulatory and other functions: Strengthen and improve the effectiveness and consistency of the regulatory model – Compliance, Enforcement and Registration Overall in the quarter 411 locations have de-registered voluntarily and 9 have de-registered following CQC intervention, there have been 5 notices of decision to cancel a registration and 219 warning notices have been served. Following feedback from the April ET and in consultation with Legal and Operations, we have refined a number of the enforcement measures. Some of the new measures include; the number of locations where warning notices are served, the number of providers deregistered following CQC intervention and locations where enforcement action is taken as a percentage of all locations. Several of the other indicators have been made clearer. The percentage of warning notices served within 14 days declined in June to 73% compared with 80% in May bringing the overall YTD figure 79.9%. Operations are investigating the causes and will take action when identified. There have been 219 warning notices served to date, which is 33 less than Q4, however significantly higher than the same period last year and above the average quarterly figure for 2011/12 of 163, the graph below illustrates the number of warning notices served in each of the last 5 quarters. . Post period update: Total warning notices served in the year to date for July was 261. In July there was an improvement in the number of warning notices issued within 14 days to 85% compared with 73% in June and 80% in May. Warning notices served in the last 5 quarters 4
CQC Performance – April - June, Q1, 2012– section 2, Deliver and Improve our regulatory and other functions Enforcement continued Ref Indicator Target Q4 11-12 Q1 12-13 YTD Trend RAG E13b Section 31 HSCA 2008 – urgent suspension of registration ,or urgent variation or imposition of conditions - N/A New 2 2 MI E13a Section 31 HSCA 2008 – urgent removal of conditions - N/A New 0 0 MI E14 Non urgent variations or imposition of conditions - N/A New 0 0 MI E15 Removal of conditions on non urgent variations or impositions - N/A New 0 0 MI E16 Non urgent cancellation of registration - N/A New N/R N/R N/A MI Registration Ref Indicator Target Q4 11-12 Q1 12-13 YTD Trend RAG R01 Percentage of new provider and manager registration applications completed within eight weeks 90% 88.7% 87.6% 87.6% G R02 Percentage of applications to change a registration completed within four weeks 90% N/A New 70.6% 70.6% R R04 % of applications rejected (Shared services) <25% 30.7% 21.8% 21.8% G R05 Applications validated within 5 days - Shared services 90% 99% 98.4% 98.4% G R07 Primary medical services providers served with all Notices of Decision by 31 March 2013 100% Tranche not yet open R08 MI Primary medical services providers served with all Notices of Decision after 31 March 2013 N/A Tranche not yet open Priority 1 – Deliver and improve our regulatory and other functions: Strengthen and improve our the effectiveness and consistency of the regulatory model – Compliance, Enforcement and Registration The percentage of variation BAU applications completed within 4 weeks was 71.4% in June compared with 68% in April and 74% in May. Underperformance is largely due to a number of applications being delayed by the provider. Overall most applications are handled within the target time. Operations are reviewing possible improvements to the process to try and separate those applications delayed by the provider, and so out of the control of the registration team, from applications that the team are able to manage. The Head of Registration is reviewing possible ways to improve how this measure is recorded. In the first quarter of the year there were 4,466 variation applications handled within the target time of 4 weeks. New registrations completed within 8 weeks has remained within green rating at 87.6% for the year, 3,931 applications have been handled within the 8 week target. Post period update: In July 80% of variation applications were completed within 4 weeks improving YTD performance to 73%. Performance of new applications has remained consistent at 89% 21.8% of applications were rejected in Quarter1 compared with a target of 25%. This compares favourably to performance in the same period last year when 43% were rejected. Applications validated in less than 5 days fell slightly when compared to Quarter 4 but remained significantly over target at 98.4% again an improvement on the same period last year when performance stood at 94%. Graph - Applications completed within the 4 week variation target 5
CQC Performance – April - June, Q1, 2012– section 2, Deliver and Improve our regulatory and other functions Priority 1 – Deliver and improve our regulatory and other functions: Strengthen and improve the effectiveness and consistency of the regulatory model – Compliance, Enforcement and Registration Overall performance against NCSC measures fell slightly in Quarter 1 compared to Quarter 4 but remains within target. There were almost 45,000 calls year to date. There were 1654 whistle blowing contacts to the NCSC of which 749 were calls to the Helpline, 685 were emails and 218 letters. In the priority areas covering safeguarding and mental health 94.0% and 95.9% of calls respectively were answered within the target time of 30 seconds, compared to 98% for both call types in Quarter 4 . Call abandonment rates remain above target despite a slight drop in Quarter1 . Performance against calls answered within time was above target. The slight drop in performance during the Quarter1 was due to one off training events for T5 , User Acceptance Training for CRM Release 18 and the NCSC staff event on values/future business objectives as well as adverse weather conditions in June. Post period update: In July there were 17,500 calls brining the year to date total to over 62,000. Call handling remained constant with all targets being exceeded and there were a further 609 whistle blowing calls In July. Graph – peaks and troughs in calls answered within target 6
CQC Performance – April - June, Q1, 2012– section 2, Deliver and Improve our regulatory and other functions Priority 1 – Deliver and improve our regulatory and other functions: Strengthen and improve the effectiveness and consistency of the regulatory model - Publication, Mental Health and Other inspections There have been almost 1.3m unique visits to the website in Q1, the most popular pages were the Homepage, organisations we regulate and the public section of the website. Graph 1 below illustrates the top 5 most visited areas. There were almost 19,000 downloads in June Compliance guidance the most popular with at almost 10,000. Weekly updates although below target are improving month on month and have compared strongly compared to last year. Post period update: There was a significant increase in visitors to the website in July when there were over 475,000 visitors bringing the year to date total to almost 1.75m visitors. Most visited pages and downloads remained constant. Graph – most visited areas of the CQC website Other inspections: In Q1 there were 8 ionising radiation (IR(ME)R) inspections, 2 more than planned. No activity has been reported against Ofsted inspections, this is being followed up and feedback will be included in the next report. HMI prisons Inspections have increased compared to Q4 from 6 to 9 and there have been 2 HMI probation inspections in the period. 1 Status updated quarterly as MHA schedules are set for quarters 7
CQC Performance – April - June, Q1, 2012– section 2, Deliver and Improve our regulatory and other functions Priority 1 – Deliver and improve our regulatory and other functions: Strengthen and improve the effectiveness and consistency of the regulatory model - Publication, Mental Health and Other inspections Mental health measures: Overall there has been a strong start to delivery of mental health operations indicators. In Q1 there were 277 visits completed which was 121% of planned activity, this compares favourably with the same period last year when 83% of scheduled visits were completed to plan. New indicators covering performance around responding to complaints from service users relating to their service providers was also above target; 96% of complaints were triaged within 3 days and 94% were responded to within 25 days compared with a target of 90% for both indicators. A number of milestones aimed at improving processes are progressing well; a new online reporting process aimed at improving the quality and timeliness of information collected from second opinion appointed doctors and the locations they visit will be rolled out between August and October. The recruitment and induction programme of an additional 50 second opinion appointed Doctors is on track to be delivered in Q3. A new indicator covering the efficiency with which allocation of requests for second opinion appointed doctors are made is below plan at 61% compared with a target of 75% however has improved in each on the three months in the quarter, 56% of requests were allocated within target in April, compared with 60% in May and 62% in June. This is expected to improve further as the improvement embeds. The introduction in August of an online SOAD request form we will report in Q3 SOAD measures covering medication, ECT and CTO visits. Monthly updates on progress against the MHA improvement plan will be made available in the ET performance reports and in the next quarterly Board report. 8
CQC Performance – April - June, Q1, 2012– section 3, Manage our organisation, people and resources Priority 3 – Manage our organisation, people and resources Establishment increased in Q1 to 2,292 compared with 2,259 in Q4 reflecting recruitment of additional compliance inspectors and other staff in the period. When compared to Q1 last year overall establishment has increased 16%. The Establishment and Vacancy rate is 14.8% for Q1, achieving the 15% target for the period Recruitment activity is progressing for a number of front line roles. There are 215 compliance inspector vacancies, and 6 training cohorts planned, 2 in each month between August and September, these will cover training for 157 CIs. To meet the additional recruitment a further training cohorts will take place in each of the 3 months of Q3, exact dates are being planned by HR. Post period update: Following additional recruitment in July the number of outstanding compliance inspectors has fallen to 80. Graph – vacancies in the last 5 Quarters 1 Actual performance is the most recent fortnight reported, therefore not an average 9
CQC Performance – April - June, Q1, 2012– section 3, Manage our organisation, people and resources Priority 3 – Manage our organisation, people and resources Resources Revenue expenditure plus depreciation Quarter1 shows an under spend of £3.1m (8% excluding fee income) consisting of staff costs of £1.8m, non Staff Costs of £0.7m and depreciation of £0.6m.The year to date underspend is in line with the £3.2m underspend forecasted in May’s report. Additional finance measures are being discussed and will be added to the next set of monthly reports. Post period update: including July expenditure year to date underspend is £3.7m – excluding fee income (£52.9m versus £49.2m) Usage of the Activity Recording Tool (ART) remains below target in the last reported fortnight but has improved significantly since April, 68% of compliance inspectors and 72% registration assessors were using the system compared with a target of 85%. Weekly MI is now sent to regions and this has had an impact on ART usage. Regional activity is given in the graphs below. Graphs – most recent two weeks usage of ART, 6 July 1 Actual performance is the most recent fortnight reported, therefore not an average 2 The rolling year average ( July 2011- June 2012) for Turnover is 7.42%and 4.11% for the sickness rate 3 Excludes fee income 10
CQC Performance – April - June, Q1, 2012– section 3, Manage our organisation, people and resources Priority 3 – Manage our organisation, people and resources Resources and Governance There were 105 stage one complaints received in Q1, in comparison with 122 in Q4 last year. The majority of these complaints recorded were about dealings with CQC mostly inspection or NCSC staff, other complaints related to or administrative processes and policies and procedures. The percentage of stage 2 complaints completed within the timescale of 20 working days remained constant at 67% when compared to Q4. There were 25 closed of these 17 were within the timescale. Most complaints over the timescale relate to complex complaints requiring additional information from the complainants. Performance in handling statutory requests started the year well, all targets for FOI, DPA and information sharing were achieved. 304 or 95.9% of requests were closed in Quarter 1 compared to a quarterly average of 351 or 98.4% in 2011/12. The scorecard shows a slight fall in percentage terms for the KPI for compliance with FOIA and DPA and information sharing statutory deadlines. This was partly due to resource and demand issues, and partly due to additional care being taken over several disclosures. Approval has been obtained to recruit an extra member to the Information Access Team to address resource issues. Post period update: Including July there have been 142 stage 1 complaints year to date. 100% of stage 2 complaints were completed in under 20 days improving year to date performance to 75%. Graph – handling for statutory requests for information 11
CQC Performance – April - June, Q1, 2012– section 4, levels of compliance and non compliance at registered locations Number of locations in each sector that meet essential standards of quality and safety By sector – location level The graph to the left illustrates levels of compliance across all sectors. As at the end of Q1 there were 13,218 compliant locations and 23,306 had not yet been subject to a review. There were 4,117 that were non compliant with at least one outcome and 93 locations were non compliant and subject to enforcement action. The table below gives a break down of actual numbers of locations that are non-compliant and subject to enforcement in the period. CQC Performance – April - June, Q1, 2012– compliance outcomes 12
CQC Performance – April - June, Q1, 2012– section 4, compliance outcomes Levels of compliance and non-compliance - registered locations NHS locations non-compliant with one or more outcomes, by age Introduction to this set of graphs: This data relating to the time locations have been non compliant is new. We have introduced it to inform our work on monitoring compliance, follow up non-compliance particularly where it has lasted for a long period. The tables show how many non-compliant locations there are each quarter grouped by the time they have been non compliant i.e. less that one quarter, between one and two quarters, to up to more than four quarters. Each quarter the information is updated to show how many of those locations still remain non compliant. See the graph below for illustration. The regions within the Operations directorate are using this useful and important new report to follow-up all outstanding areas of non-compliance. Operations has began by focusing on those outliers who have been non-compliant for more than a year. Our analysis highlights cases where inspectors are working closely with the provider to support a return to compliance in the future. In some cases follow-up inspections have identified non-compliance with further regulations, leading to a longer period of non-compliance. The data has also shown that in a few instances some providers are now compliant, but the inspector has not yet updated the system. We are correcting this. Operations plan to run this new report monthly to ensure we keep a tight grip on all non-compliant providers. The data will also help inspectors to ensure we meet the target to follow-up non-compliance within 12 weeks of when an action plan shows the area of non-compliance has been addressed. There were 35 non compliant locations in Q4 2011/12 29 of them were still non compliant at the end of Q1 2012/13 13
CQC Performance – April - June, Q1, 2012– section 4, compliance outcomes Levels of compliance and non-compliance - registered locations ASC locations non-compliant with one or more outcomes, by age 14
CQC Performance – April - June, Q1, 2012– section 4, compliance outcomes Levels of compliance and non-compliance - registered locations IHC, Primary Dental Care and Independent Ambulance, locations non-compliant with one or more outcomes, by age 15
CQC Performance – April - June, Q1, 2012– section 5, deliver our equality objectives All priorities – corporate equality objectives Commentary: At the start of the financial year the commission published our internal equality objectives. All of the objectives have been embedded in the reporting cycle and will be included in the quarterly reports to the ET and Board. All objectives were rated as green and on track to be achieved for the year. Notable progress in Q1 included an action (as part of EQ2) on the evaluation of EDHR in reviews of compliance to identify where the Commission need to carry out development work to ensure that the Commission identifies and responds appropriately to EDHR issues in compliance monitoring the evaluation is on track. Further information will be included in the mid year performance report. 16
CQC Performance – section 6, understanding the scorecard • Compliance • A key part of our regulatory work is carrying out inspections to determine whether services are meeting the government standards. Our inspections focus on the outcomes that we expect people to experience when they use a service and assess the care, treatment and support they receive. Inspections include information from a range of sources including service users, the public, commissioners and other regulators. The measures in this section monitor the commitments we made to inspect services this year. • Our inspections of NHS Trusts include inspecting acute hospitals. The term 'acute' is used when referring to active care or treatment (usually in secondary care) to adults, children, or both, that requires urgent or emergency care, usually within 48 hours of admission or referral from other specialties, and includes recovery time from surgery. • Our publication ‘How CQC regulates’ was published alongside our business plan and explains the types of inspection we undertake: • Scheduled inspections are planned by CQC in advance and can be carried out at any time. • Follow up inspections are made when we want to check whether the provider has made improvements we are requiring them to make • Responsive inspections are where inspectors inspect because of a specific and immediate concern. • Themed inspections are where we look at a particular type of care or issue across one or more care sectors, for example dignity and nutrition in NHS hospitals, or care for people with a learning disability in both care homes and hospitals. • Complaints • The CQC welcomes comments and suggestions about performance and the conduct of staff, including complaints about the CQC. Every complaint is investigated, and the feedback used to develop and improve the Commissions services. These measures demonstrate the volume, efficiency and overall effectiveness of how complaints are handled. Enforcement We have a variety of enforcement powers available to us where we find a service is not meeting one or more of the standards. When we exercise these powers we do so in a proportionate way, considering the effect on the public and those who use services. This suite of powers enables us to take swift, targeted action where services are failing the people who use them. We report in our scorecard on the enforcement actions we have taken. A detailed description of our enforcement actions is available on our website. One of the most often used of our enforcement powers is a Warning notice. A warning notice tells a 'registered person' that they are not complying with a condition of registration, requirement in the Act or a regulation or any other legal requirement we think is relevant. They can be published if the provider has been given the opportunity to make representations and where those representations if made are not upheld. Our enforcement powers also include suspending or cancelling the service’s registration, or prosecution. Equality Setting equality objectives is a requirement for public sector bodies under the Equality Act 2010 specific duties regulations. The objectives that we have set for the CQC are stretching and they focus on the biggest equality challenges that we face. The objectives are listed here and are reported quarterly, they will track delivery of supporting work against each objective. FinanceOur finance measures cover high level expenditure against budget and how effective the Commission is at collecting fees due. Human Resources The indicators in this area demonstrate the overall key human resources performance areas and cover, vacancy rate, staff turnover, the sickness rate and the Commission's establishment Publication The Commission publishes information about the services it regulates on the CQC website. It also produces a number of publications each year covering reports, surveys, themed inspections, reviews and studies. These measures indicates how well the Commission is in getting information to people in a timely way. Mental Health We protect the rights of people being treated under the Mental Health Act. Our aim is to improve the outcome for every person who uses care services commissioned under the Act. Indicators in this area cover, Commissioner visits, second opinion appointed doctor service and complaints from service users about providers. Commissioner's visit wards that detain people under the Mental Health Act. They meet patients and ensure staff use their powers appropriately. These measures track the Commission's performance against the number of visits planned. The SOAD service safeguards the rights of patients detained under the Mental Health Act who refuse the treatment prescribed to them or are deemed incapable of consenting. The role of the SOAD is to decide whether the treatment recommended is clinically defensible and if consideration has been given to the views and rights of the patient. National Customer Service Centre The National Customer Service Centre (NCSC) is the first point of contact for members of the public, service users and providers. These measures demonstrate the level of efficiency of the NCSC in terms of the speed at which we respond to the calls we receive and how they are prioritised, as well as the volume of calls we respond to. Other Inspections The Commission has the power to inspect a range of other specific areas, all of the measures in this area track our delivery of inspection activity against our plan. IR(ME)R - the Ionising Radiation (Medical Exposure) Regulations, our inspections monitor the use of ionising radiation for medical exposure. Controlled drugs covers a range of areas including assessing and overseeing how health and social care providers manage controlled drugs. The Pharmacy team supports Compliance function in specific activities relating to controlled drugs. There are also a number of joint inspections were the CQC work with other regulators, for example a 3 year programme of inspections covering all local authority areas in terms of their provisions for child safeguarding and looked after children with Ofsted, and joint inspections with HM Inspectorate of Prisons and HM Inspectorate of Probation. Registration To be registered with the CQC, providers must meet the essential standards of quality and safety for each regulated activity they provide at each location. Providers will not be registered if they cannot declare full compliance. These measures capture the efficiency of the Commission in processing these applications. 17