Download
1 / 53
540 likes | 748 Views
Dop pler Patterns - Outline. Dop pler Basics Dop pler Signatures Basic Signatures Wind Analysis (Convection, Synoptic Flows) Advanced Signatures Atmospheric Diagnosis (VWS, Stability, Trends) Conveyor Belt Conceptual Model (CBCM) Summary. Many of the following signatures

E N D
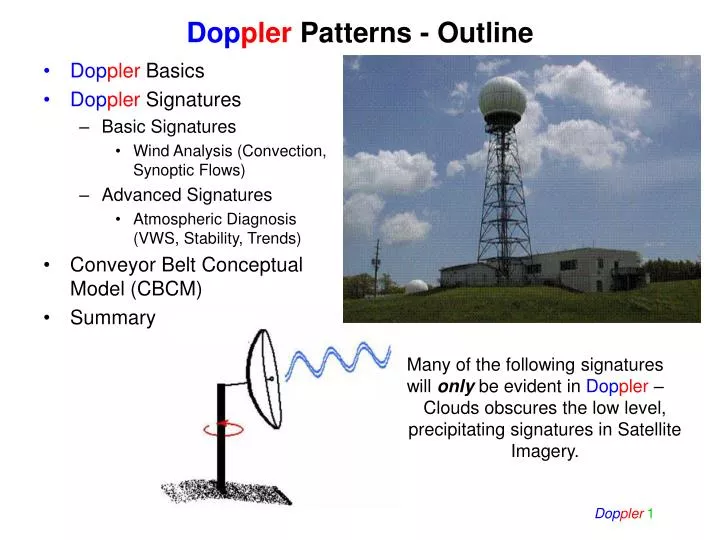
Doppler Patterns - Outline • Doppler Basics • Doppler Signatures • Basic Signatures • Wind Analysis (Convection, Synoptic Flows) • Advanced Signatures • Atmospheric Diagnosis (VWS, Stability, Trends) • Conveyor Belt Conceptual Model (CBCM) • Summary Many of the following signatures will only be evident in Doppler – Clouds obscures the low level, precipitating signatures in Satellite Imagery.
Doppler Patterns Analysis and Diagnosis for All Seasons TheDoppler Mantra ‘Look for Something “Odd”’ “Look UP ”
What You Know from Part 1 of the Radar Course • The Doppler Effect and Shift • Doppler Weather Radar • Velocity Determination • Signal Processing • Limitations • More on Velocity Aliasing • Solving the Doppler Dilemma • PPI Displays of Raw Doppler Data of Radial Wind • Determining Wind Direction • Wind Profiles • Vertical Profiles • Broadscale Flows • Mesoscale Flows
Doppler Radar Quantities – The Data Mean Radial V • Backscattered power (R) • equivalent reflectivity factor and • estimates of the precipitation rate • Mean radial velocity (V) • Spectral width of radial velocity of targets within the sample volume (W) Spectral Width Integral of S(v) over V R=
Spectral Width and “Doppler Display Texture” RainDoppler Texture Snow Doppler Texture
Velocity Azimuth Display - VAD • At a given height (h), then the radial velocity is: Vr • For a uniform flow field, assume Vw (Vertical Velocity) approximately = 0 • Best fit of a sine curve to the observations around the circle. Maximum Outbound Maximum Inbound Maximum Outbound No Radial Maximum Inbound
Velocity Azimuth Display - VAD • VAD accuracy decreases with elevation angle and height. The desired horizontal wind component becomes a smaller part of the radial wind component actually measured. • Errors in the radial component has a bigger impact on the accuracy of the horizontal wind • Variation in the Doppler velocity are pronounced at the higher elevation angles – shooting through the precipitation?
Doppler Wind Shifts – Viewing Angles B A The angle of viewing is very important and determines what one sees!
Doppler Radar Analysis and Diagnosis Quantities • Determining the Horizontal Winds • Curvature • Convergence • Wind Shear • VWS Trends • Thermal Advections • Stability • Stability Trends • Doppler Texture and Spectral Width • Precip Phase • Doppler Data and Viewing Angle • Limitiations Know the limitations of the data…
Horizontal Wind Determination Max/Min Method Comes in … Goes out • Caution: • Not all flows are uniform • Important flows not uniform
Horizontal Wind Determination Zero Isodop Method Comes in … Goes out • Caution: • Think the pattern through • Deduces important non- uniform flows The Purple Vectors Have ZERO radial Component – Not measured.
Doppler Wind Signatures Constant Direction and Speed Comes in … Goes out Constant Direction But Speed Increases With Height (Range) Comes in … Goes out
Comes in …Goesout Doppler Wind Signatures Constant Direction But Speed Maximum Horizontal Flow Comes in … Goes out Constant Direction But Ascending Speed Maximum
Doppler Wind Signatures Divergence Continuity requires ascent from below Convergence Continuity requires descent to below
Doppler Wind Signatures Backing Counter-clockwise Isodop With Height Cold Advection Veering Clockwise Isodop With Height Warm Advection
Broad Scale Flow Doppler Wind Signatures - Doppler Vortex ‘Look for Something “Odd”’
Doppler Wind Signatures - Doppler Downburst ‘Look for Something “Odd”’ DopplerRadial Divergence DopplerRadial Convergence…
Doppler Wind Shear Zero Isodop Method Winds Back with height = VWS = Coldadvection Back Back Isodop Arc backs or is counter-clockwise with height/range Cold VWS Cold Advection
Doppler Wind Shear • “look for something odd” Winds Veer with height = VWS = Warmadvection Veer Veer Isodop Arc veers or is clockwise with height/range Warm VWS Warm Advection Think in 3-D
Vertical Discontinuities “look for something odd” follow a range ring for vertical discontinuities SW - Level SE - Level SW - Level
Horizontal Discontinuities “look for something odd” follow a radial looking for discontinuities that do NOT follow along a range ring… NW – Level ? SW - Level ?
Doppler Practice Black range ring separates VeeringIsodop from Backing Isodop “look for something odd” Cooling Warming Under High Level Backing Low Level Veering What are the implications for vertical stability?
SWLY Vertical NNELY Doppler Practice ‘Look for Something “Odd”’ LLJ QS Horizontal LLJ Winds Backing with Height - Cold Air Advection Cold Conveyor Belt ahead of a synoptic system… Horizontal or Vertical Discontinuity? Cold front with surface discontinuity to the southeast. March 93 – the storm of the century! Snow!
Doppler Wind Analysis – More Practice • Isodop Wind Analysis • Follow isodop outward • Draw line back to radar • Wind is perpendicular to this radial, towards the red echoes
Doppler Wind Analysis – More Practice • For any height you can determine the wind in four locations • Determine the two isodop winds • For the maximum winds look roughly 90° away from the isodop winds • The wind maxs are where the winds align along a radial • Full wind toward radar • Full wind away from radar • Analyze areas of non-uniform flow • curvature from direction • confluence from speed At 5.3 km … Anticyclonic Ridge with mass convergence Subsidence below. Nil pcpn above. What’s your short range forecast?
Doppler Wind Analysis – Even More Practice Range Ring Discontinuity - Difference in the Vertical • Below Discontinuity • NLY winds veering 30o with height • Warm advection • Max wind rising a lot • ACYC curvature • No sig convergence ….23kts in 23kts out…. 23 • Isodop Discontinuity • Veers clockwise • Warm front 23 • Above Discontinuity • SLY winds nil directional shear • Nil thermal advections • ACYC curvature • Mass convergence …60kts in only 45kts out.. • Discontinuity Slope • 2.4 km SE rising to 2.8km NW • 2.7 km S steady to 2.7 N Synoptic Situation … Zonal frontal zone with stable waves Warm front slanted toward the NNW. Subsidence below. but strong Cold Conveyor Belt – nil motion
C D B Diagnosis of VWS – Isodop Method = VWS Inflection • Determine the wind at B. Draw a radial line from the radar site A to the isodop at B. • Determine the wind at C. • The wind backs from B to C. Relative to A the isodop backs or turns counter-clockwise as well. • Determine the wind at D. • The wind veers from C to D. The isodop veers or turns clockwise as well. A Summary • Thermal Advection Intensity • The larger the angle subtended by the arc, the larger the wind shift and stronger the thermal advections. • This angle is independent of range from the radar • Thermal Advection Type • If the isodop turns counter-clockwisewith height (increasing range), the arc is associated with cold advection… winds back with height. • If the isodop turns clockwise with height (increasing range) the arc is associated with warm advection… winds veer with height. • The VWS inflection at the limiting radial marks the range/height separating backing and veering portions of the isodop.
D D D C A B C A B Thermal Advections and VWS • The angle subtended by the counter-clockwise isodop BC is identical in 1, 2 and 3. • In 1, winds back over a short radial range • Radial range & height difference increases for 2 • Radial range difference is even more for 3 • Height interval for the Thermal VWS increases with the length of the radial DC from case 1 to 3 • Thermal VWS determined by dividing the directional shear (isodop angle) by the height interval (Difference between AC and AD=DC): • Strongest for 1 • Moderate for 2 • Weakest for 3. • Thermal VWS is proportional to the size of the subtended angle divided by the radial range (AC-AD=DC) which is inversely proportional to area BCD C 1. A B 2. ~1/Small Area ~1/Medium Area Radial ~1/Large Area Isodop 3. Range Ring WS Isodop Angle 1 VWS = = ~ Depth Radial Height Change Isodop Area (BCD)
Level C Level C Level C DopplerIsodops for Increasing ? Stability D Level D Weaker cold advection CD Stabilization Stronger cold advection BC C Level B Backing Wind Turning Along the Radial 1. A B Level D Stronger warm advection CD C Stabilization B Weaker warm advection BC Level B 2. Veering Wind Turning Along the Rings A D Level D (Strong) Warm advection CD C Stabilization (Weak) Cold advection BC Level B 3. A D B Note: Angles kept constant. Changing the Thermal Advection Intensity by changing the depth of the directional wind shear.
C A B C B A D C A D B Isodop Diagnosis of Stabilization Trends Stability increases with: • Cold advection decreasing with height: • Angle of backingDopplerisodopveers to become more aligned along a radial, • Warm advection increasing with height: • Angle of veeringDopplerisodopveers to become more aligned along the range rings, • Coldadvection underwarm advection: • Doppler isodopbacking counterclockwise with height (range) underDopplerisodopveering clockwise with height (range). • Following the Isodop – for Stabilization Remember: Veering with Height = Warming with Height = Stabilization (Red = Stop) Cold Advection - Backing Veers Warm Advection - VeeringVeers Important Generalization: ForStabilization Isodopveerswith height/range
D C A B B C D A D B C A Isodop Diagnosis of Destabilization Trends Stability decreases (Destabilization) with: • Cold advection increasing with height: • Angle of backingDopplerisodopbacks to become more aligned along the range rings • Warm advection decreasing with height: • Angle of veeringDopplerisodopbacking to become more aligned along a radial, • Warm advection undercold advection: • Doppler isodopveeringclockwise with height (range) under Dopplerisodopbacking counterclockwise with height (range). • Following the Isodop – for Destabilization Remember: Backingwith Height = Cooling with Height = Destabilization(Green = GO) Cold Advection - Backing backs Warm Advection - Veering backs Important Generalization:ForDestabilizationIsodop backswith height/range
DopplerExample Isodops for Increasing Instability – Differential Warm Advection in the Vertical Stronger Destabilization • Southeast of the radar isodop CD subtends a veering, clockwise angle with range/height. This is warm advection. • Warm advection CE is stronger than that for ED. • The air mass is strongly destabilizing southeast of the radar. Isodopbacks with height/range. • For AB, AF and FB, the air mass northwest of the radar is also destabilizing • even more…larger angle in about the same height interval. • Larger angle • Along range ring B F A • Smaller angle • Along range ring The Virga Hole Weaker Destabilization Isodop Backs C IsodopBacks with height (relative to the range rings) E D Destabilization
Doppler Analysis & Diagnosis Strategies An operational guide to getting the most information from Doppler radar: • Look for Something “Odd” • Determining the actual Wind Direction and Speed – BluetowardsRedAway Curvature from direction & Mass Convergence from speed • Determining VWS - Windbacking & veering with height for Thermal Advections Angle subtended by Isodopveersfor Warm Advection Angle subtended by Isodop backsfor Cold Advection • Determine Trends in the VWS - Angle between the Isodop and Range Rings If angle (area) increases (in time) then vertical wind shear/thermal advection is decreasing If angle (area) decreases (in time) then vertical wind shear/thermal advection is increasing • Determining Stability Trends -Isodopbacking & veering with height relative to range rings ForStabilization Isodopveerswith height/range ForDestabilizationIsodop backswith height/range Stabilization/Destabilizationrate stronger for longer legs… • Diagnosing Vertical versus Spatial wind discrepancies Along a Range Ring versus along Radial … some of this is probably new to you … I made it up :>) Increasing Decreasing Stronger Destabilization Stronger Destabilization Discontinuities in the Vertical Follow the range rings Discontinuities in the Horizontal Tend to be lines
The Doppler Twist Signature - Example • White vectors match the colours from one level to a higher level – difficult to do. • Direction of rotation indicates the type of thermal advection associated with the Doppler Twist. • Length of the vectors indicate the relative magnitude of the thermal advection. • An example of the Virga Hole Signature The Virga Hole Veering Lid Twist Signature
The Doppler Twist Signature - Example • White vectors match the colours from one level to a higher level – difficult to do. • Direction of rotation indicates the type of thermal advection associated with the Doppler Twist. • Length of the vectors indicate the relative magnitude of the thermal advection. • An example of the Virga Hole Signature Lower Virga 210o 260o The Virga Hole 260o Virga Higher
The Doppler Twist Signature - Example • The obvious white line separates different wind regimes in the vertical. • It also separates regimes of differing Doppler texture. • Above the white line the Doppler texture is uniform and characteristic of snow. • Below the white line the texture is lumpy like oatmeal and characteristic of rain. • There is Virga – no rain to the ground. • Consider the dashed line. The white line is the warm front. The layer immediately below is where the snow is melting into rain. See the DopplerTexture… Is the dashed line a better analysis for the warm front! Were we analyzing the melting layer before … Typically cold air gets deeper & warm front gets higher to the north. Keep an open mind & get all the data you can!
12Z March 10, 2009 Virga R-R Winds veer from SE at the surface to SSW in 2.6 km Any chance of ZR-? Nil chance of ZR- due veering, warm advection under the warm front – no below freezing layer at ground. NO ZR- Doppler adds a lot of information to the surface map…
R C L Doppler and the Conveyor Belt Conceptual Model North of the Surface Warm Front Conceptual Models R = Right of the Col C = Centered on the Col L = Left of the Col End
The Conveyor Belt Conceptual Model NLY Flows Sinking Isentropically SLY Flows RisingIsentropically Think in 3-D End
C C C WCB DCB CCB DCB Vertical Deformation Zone Distribution & CBMSimplified Summary WCB overrides the warm front CCB undercuts the warm front CCB wind shear variable Nil Frontal surface overlies mixing layer Veering Backing • Looking along the WCB flow: • In WCB right of the Col expect veering winds with height – Katabatic (red for stop) warm front • In WCB approach to the Col expect maximum divergence – the eagle pattern with ascent and increasing pcpn • In WCB to the left of the Col expect backing winds with height – Anabatic (green for Go) warm front End
CCBDoppler Diagnosis – Conceptual Models The CCB Conceptual Model is independent of that in the WCB. Like Mr. Potato Head, one can mix and match conceptual models in the distinctly different conveyor belts. B B C C A A The Beaked Eagle The Headless Eagle • A is the radar site • AB is backing with height indicative of cold advection where really there should be veering as a result of the Ekman Spiral • BC is veering with height indicative of warm advection • B is the front with the mixing layer hidden in the cold advection • This is a strong cold advection • The warm front will be slow moving or stationary • A is the radar site • ABC is all veering with height indicative of warm advection. Layer AB is apt to be partially the result of the Ekman Spiral • BC is veering with height indicative of warm advection • Where is the front and the mixing layer? • The cold advection is not apparent and the warm front will advance End
C o Warm frontal surface Mixing layer Cold CB Warm CB WCB to the Right of the Col The Warm Right Wing Stoop CM The eagles right wing is folded in as if it is about to swoop down. The left wing is still fully extended to catch the lift of the WCB. Signature of Warm Frontal surface Warm advection • Within the CCB: • Probable Ekman spiral nearest surface • Probable cold advection above Ekman spiral Right Wing Left Wing • Within the WCB: • East of radar veering, warm advection • West of radar nil VWS End
B Warm Frontal Cross-section along Leading Branch of the Warm Conveyor Belt (WCB) Common location for virga A WCB WCB oriented for maximum frontal lift Virga Precipitation Increasing CCB Moistening WCB oriented for less frontal lift Lower Hydrometeor Density Mixing Zone Surface Warm Front CCB B A Cold air in Cold Conveyor Belt (CCB) deep and dry Moist portion of Warm Conveyor Belt (WCB) is high and veered from frontal perpendicular – katabatictendency Dry lower levels of WCB originate from ahead of the system and veered from frontal perpendicular WCB typically veers with height (it is after all, a warm front) Frontal slope is more shallow than the typical 1:200 Precipitation extends equidistant into the unmodified CCB Precipitation extends further into the moistened, modified CCB End
Inactive or Katabatic Warm Front Descent into DIV Winds in warm air Above front slower Than front Winds veer with height above the warm front to the right of the COL Veeringwinds meanstableKnot activeRed for “Stop” End
C o WCB Approaching the Col The Warm Screaming Eagle CM Both wings are fully extended to catch the lift of the WCB. This is a divergent signature. Warm CB Warm frontal surface Signature of Warm Frontal surface discontinuity Mixing layer • Within the CCB: • Probable Ekman spiral nearest surface • Probable cold advection above Ekman spiral Cold CB Right Wing Left Wing • Within the WCB: • East of radar veering, warm advection – katabatic warm front. • West of radar backing, cold advection – anabatic warm front. End
B Warm Frontal Cross-section along Central Branch of the Warm Conveyor Belt (WCB) A Common location for both precipitation and virga WCB WCB oriented for maximum frontal lift Virga Precipitation Increasing CCB Moistening Lower Hydrometeor Density Mixing Zone Precipitation At Surface Surface Warm Front CCB B A Cold air in Cold Conveyor Belt (CCB) more shallow and moist Moist portion of Warm Conveyor Belt (WCB) is thicker, higher and perpendicularto front Lower levels of WCB have the same origin as the upper level of the WCB - frontal perpendicular WCB shows little directional shift with height. A greater WCB depth is frontal perpendicular Frontal slope is near the typical 1:200 Precipitation extends further into the moistened, modified CCB. Horizontal rain area begins to expand as CCB moistens. End
Need to emphasize The PPI nature of the Doppler scan - The cone D A G C B E F H The Warm Screaming Eagle Conceptual Model End
C o Warm frontal surface Mixing layer Cold CB Warm CB WCB to the Left of the Col The Warm Left Wing Stoop CM The eagles left wing is folded in as if it is about to swoop down. The right wing is still fully extended to catch the lift of the WCB. Signature of Warm Frontal surface … odd? Signature of Warm Frontal surface Warm advection • Within the CCB: • Probable Ekman spiral nearest surface • Probable cold advection above Ekman spiral Right Wing Left Wing • Within the WCB: • West of radar backing, cold advection • East of radar nil VWS End
B Warm Frontal Cross-section along Trailing Branch of the Warm Conveyor Belt (WCB) A Common location for precipitation to ground! WCB WCB oriented for maximum frontal lift Virga Precipitation Increasing CCB Moistening Lower Hydrometeor Density Mixing Zone Precipitation At Surface Surface Warm Front CCB B A Cold air in Cold Conveyor Belt (CCB) even more shallow and more moist Moist portion of WCB is thicker, higher and backed from frontal perpendicular – anabatic tendency Lower levels of WCB have the same origin as the upper level of the WCB WCB backs slightly with height in spite of the warm air advection. A greater WCB depth is frontal perpendicular Frontal slope likely steeper than the typical 1:200 Precipitation extends further into the moistened, modified CCB. Horizontal rain area expands rapidly as CCB moistened. End
B A G D A C B F End