Download

1 / 37
370 likes | 382 Views
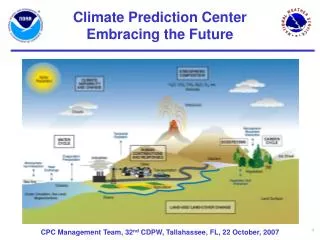
Climate Prediction Center Monitoring Products Dr. Gerald Bell Climate Prediction Center/ NOAA/ NWS National Centers for Environmental Prediction (NCEP) Camp Springs, MD www.cpc.ncep.noaa.gov. Outline. Climate monitoring versus assessment Overview of CPC climate monitoring products

E N D
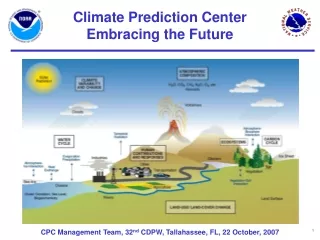
Climate Prediction Center Monitoring Products Dr. Gerald Bell Climate Prediction Center/ NOAA/ NWS National Centers for Environmental Prediction (NCEP) Camp Springs, MD www.cpc.ncep.noaa.gov
Outline • Climate monitoring versus assessment • Overview of CPC climate monitoring products • Main monitoring products • Global Temperature and Precipitation • Drought and Soil Moisture • ENSO • Madden Julian Oscillation (MJO) • Atlantic and East Pacific Hurricanes • Teleconnections • 4. Summary
Monitoring Examination of daily, monthly, seasonal, etc. analyses of atmospheric and oceanic variability Helps to identify and understand current and past short-term climate anomalies Critical for understanding and predictions Assessment Analysis of the current or past conditions designed to aid our understanding of a particular climate phenomenon or event. Examples: ENSO Assessments, special climate assessments, seasonal climate asssessments. Critical for understanding and predictions Climate Monitoring versus Assessment
Overview of CPC Monitoring Products CPC home Page: www.cpc.ncep.noaa.gov
Overview of CPC Monitoring Products Expert Assessments Expert Assessments Index Climate Diagnostics Bulletin Weather and Climate Hazards ENSO, Drought Special Climate Summaries Annual Climate Assessments Seasonal Climate Monitoring
Overview of CPC Monitoring Products Seasonal Climate Monitoring Expert Assessments Index Seasonal Climate Summaries Seasonal Assessment, SST, Circulation in Tropics and Extratropics,Precipitation, Temperature, Animations
Overview of CPC Monitoring Products Monitoring and Data Index Other items on page: Drought Soil Moisture Snow Cover Degree Days Africa Maps and Data Pacific Islands data Forecast Performance
Surface Temperature Monitoring Daily Temperature Analysis Click • Analyses in (F) and (C) • Analyses include • Mean Temps, Max and Min Temps • Daily, 5-day, 7 day, 30 day, 90 day • Data Stations: • River Forecast Centers ~ 2500/per day • Hydrologic Auto data System ~ 1500/ day • Grid resolution: 0.5 X 0.5 degree
Surface Temperature Monitoring 30-day Means and Anomalies
Surface Temperature Monitoring 365-day Temperature Time Series Click Monitoring and Data Temperature Time Series
Precipitation Monitoring Daily Precipitation Analysis Click
Precipitation Monitoring Daily Precipitation Analysis United States Click • Gridded Precipitation Analyses include • Daily, 7 day, 30 day, 90 day, 180 day, • 365-day averages, month-to-date totals. • Download gridded data • Data Stations: • River Forecast Centers ~ 5000/per day • Hydrologic Auto data System ~ 1500/ day • Minimum of 500 stations required • Grid resolution: 0.25 X 0.25 degree • Quality Control: • Duplicate Station Check • Data check (buddy check, outliers • NEXRAD check for spurious zeros
Daily Precipitation Analysis Example of 180-day Precipitation Analysis
Daily Precipitation Analysis Precipitation Station Coverage
Precipitation Monitoring Global Precipitation Time Series’ Monitoring and Data Precipitation Time Series Click Click on station to get Precipitation time series
Precipitation Monitoring Example of 90-day Precipitation Time Series
Drought monitoring Monitoring & Data U.S. Climate & Data Maps Products Drought
Drought Monitoring Palmer Drought Index
Soil Moisture Monitoring & Data Index Soil Moisture • Soil Moisture Analysis • Outlook Maps • Evaporation • Runoff • Recent Anomalies • Recent Changes • Climatology • Drought Indicators
Soil Moisture Example of Soil Moisture Anomalies
U.S. Drought Assessment Home Climate Highlights Drought Assessment • Information Used to Make Drought Outlook • Seasonal Outlooks • Drought data • Drought Indicator Blends • Soil Moisture Data • Precip. and Temp.
Monitoring Tropical Climate Variability Home Climate & Weather MJO El Niño /La Nina • Current Conditions—Weekly Update (.ppt) • Animations • Weekly and Monthly Analyses • Diagnostics Discussion • Tutorial
Monitoring Tropical Climate Variability Powerpoint Presentations of latest ENSO and MJO conditions Weekly ENSO Update El Niño /La Nina ENSO Evolution, Status, and Prediction Presentation Weekly MJO Update MJO MJO Weekly Update
Monitoring Tropical Climate Variability Time Series of Weekly SST Anomalies for the 4 Niño Regions Weekly SST Anomalies
Monitoring Tropical Climate Variability Outgoing Longwave Radiation (OLR) AnomaliesMeasures Anomalous Tropical Convection Drier-than-average conditions (orange/red shading) Time Wetter-than-average conditions (blue shading) Longitude
Monitoring Tropical Climate Variability Madden / Julian Oscillation (MJO) 200-hPa Velocity Potential Anomalies show MJO the best Positive anomalies (brown shading) indicate unfavorable conditions for precipitation. Negative anomalies (green shading) indicate favorable conditions for precipitation. Longitude
Subsurface Temperature Departuresin Equatorial Pacific Monitoring Tropical Climate Variability Ocean model creates gridded sub-surface temperature using buoy data, sounding data from TOGA TAO array, etc. Mid-Feb Early Mar Mid-Mar Early Apr EL Niño Warming along Thermocline, Combined with down-welling phase of Kelvin Wave triggered by MJO Anomalous warmth in East due to Kelvin Wave. 180 120W
Monitoring North Atlantic and East Pacific Hurricane Potential Monitoring and Data Index Monitoring Atlantic Hurricane Potential Monitoring East. Pac. Hurricane Potential
Monitoring North Atlantic Hurricane Potential Analyses are related to Monitoring key Circulation features associated with Hurricane formation Enhanced Tropical Easterly Jet (200-mb) Warmer SSTs Lower Vertical Wind Shear and Surface Pressure (Red Area) Higher Pressure in Upper Atmosphere Upper-level Easterlies Expand Westward (Green arrows) Favorable African Easterly Jet Weaker Easterly Trade Winds (Dark Blue arrow)
Monitoring North Atlantic Hurricane Potential Weekly SST Departures Very warm SSTs persist in Tropical Atlantic
Monitoring North Atlantic Hurricane Potential 700-hPa: African Easterly Jet (AEJ) AEJ already showing increased cyclonic shear and weaker easterly trades. Classic signal for active Hurricane season
Monitoring North Atlantic Hurricane Potential Area-averaged 200-hPa streamfunction anomalies Show strength of subtropical ridge across the North Atlantic Orange shows enhanced subtropical ridge. Strong intra-seasonal variability due to MJO is seen.
Northern Hemisphere Teleconnection Patterns Monthly and Daily analyses Monthly: Monitoring and Data Index Northern Hemisphere Teleconnection Patterns Daily: Climate and Weather Teleconnections Monthly: Patterns, Calculation procedure, Description of 10 leading teleconnection patterns Time Series Associated temp and precipitation departures Daily: Observed time series of PNA, NAO, AO. MRF and ensemble forecasts
Northern Hemisphere Teleconnection Patterns North Atlantic Oscillation (NAO) Time Series Based on standardized 500-hPa height anomalies Daily Monthly
Northern Hemisphere Teleconnection Patterns MRF Model Forecasts of NAO
Northern Hemisphere Teleconnection Patterns Ensemble Model Forecasts of NAO
Summary Atlantic SST Anomalies 200-hPa Velocity Potential Anomalies