Download
1 / 10
100 likes | 172 Views
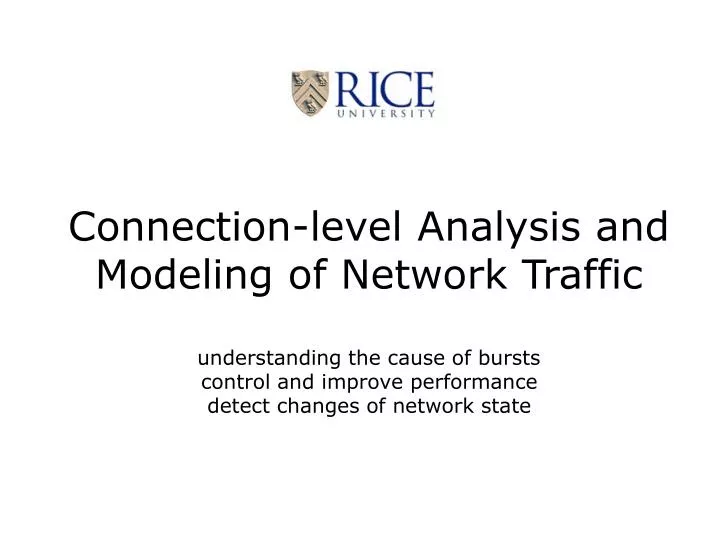
Connection-level Analysis and Modeling of Network Traffic understanding the cause of bursts control and improve performance detect changes of network state. Explain bursts. Large scale: Origins of LRD understood through ON/OFF model

E N D
Connection-level Analysis and Modeling of Network Trafficunderstanding the cause of burstscontrol and improve performancedetect changes of network state
Explain bursts • Large scale: Origins of LRD understood through ON/OFF model • Small scale: Origins of bursts poorly understood, i.e., ON/OFF model with equal sources fails to explain bursts Load (in bytes): non-Gaussian, bursty Number of active connections: Gaussian
99% Mean Non-Gaussianity and Dominance Connection level separation: • remove packets of the ONEstrongest connection • Leaves “Gaussian” residual traffic Traffic components: • Alpha connections: high rate (> ½ bandwidth) • Beta connections: all the rest = + Overall traffic 1 Strongest connection Residual traffic
5 2 10 10 Beta Beta Alpha Alpha 4 1 10 10 cwnd (B) 3 0 10 10 2 -1 10 10 3 4 5 6 3 4 5 6 10 10 10 10 10 10 10 10 peak-rate (Bps) Correlation coefficient=0.01 CWND or RTT? Colorado State University trace, 300,000 packets 1/RTT (1/s) peak-rate (Bps) Correlation coefficient=0.68 Short RTT correlates with high rate Challenge: estimation of RTT and CWND/rate from trace / at router
Impact: Performance • Beta Traffic rules the small Queues • Alpha Traffic causes the large Queue-sizes (despite small Window Size) Queue-size overlapped with Alpha Peaks Total traffic Alpha connections
Two models for alpha traffic Impact of alpha burst in two scenarios: Flow control at end hosts TCP advertised window Congestion control at router TCP congestion window
Modeling Alpha Traffic • ON/OFF model revisited: High variability in connection rates (RTTs) Low rate = beta High rate = alpha + + + = = stableLevy noise fractionalGaussian noise
De-Multiplexing: Equal critical time-scales Q-tail Pareto Due to Levy noise Self-similar Burst Model • Alpha component = self-similar stable • (limit of a few ON-OFF sources in the limit of fast time) • This models heavy-tailed bursts • (heavy tailed files) • TCP control: alpha CWND arbitrarily large • (short RTT, future TCP mutants) • Analysis via De-Multiplexing: • Optimal setup of two individual Queues to come closest to aggregate Queue Beta (top) + Alpha
ON-OFF Burst Model • Alpha traffic = High rate ON-OFF source (truncated) • This models bi-modal bandwidth distribution • TCP: bottleneck is at the receiver (flow control through advertised window) • Current state of measured traffic • Analysis: de-multiplexing and variable rate queue • Queue-tail Weibull (unaffected) unless • rate of alpha traffic larger than • capacity – average beta arrival • and duration of alpha ON period heavy tailed Beta (top) + Alpha Variable Service Rate
Conclusions • Network modeling and simulation need to include • Connection level detail • Heterogeneity of topology • Physically motivated models at large • Challenges of inference • From traces • At the router • Need for adapted Queuing theory