Download
1 / 41
410 likes | 510 Views
Discrimination. or Class prediction or Supervised Learning. cDNA Microarrays Parallel Gene Expression Analysis. 6526 genes /tumor. Motivation: A study of gene expression on breast tumours (NHGRI, J. Trent).

E N D
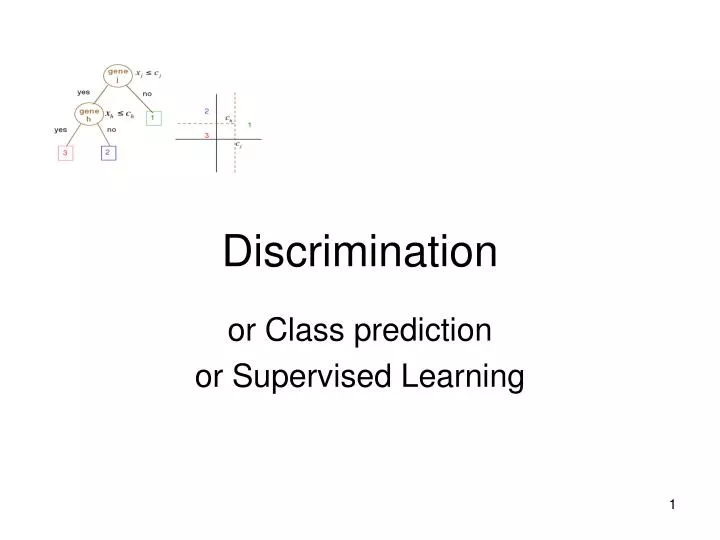
Discrimination or Class prediction or Supervised Learning
cDNA Microarrays Parallel Gene Expression Analysis 6526 genes /tumor Motivation: A study of gene expression on breast tumours (NHGRI, J. Trent) • How similar are the gene expression profiles of BRCA1 and BRCA2 (+) and sporadic breast cancer patient biopsies? • Can we identify a set of genes that distinguish the different tumor types? • Tumors studied: • 7 BRCA1 + • 8 BRCA2 + • 7 Sporadic
Discrimination • A predictor or classifier for K [tumor] classes partitions the space X of gene expression profiles into K disjoint subsets, A1, ..., AK, such that for a sample with expression profile x=(x1, ...,xp) Ak the predicted class is k. • Predictors are built from past experience, i.e., from observations which are known to belong to certain classes. Such observations comprise the learning set L = (x1, y1), ..., (xn,yn). • A classifier built from a learning set L is denoted by C( . ,L): X {1,2, ... ,K}, with the predicted class for observation x being C(x,L).
Discrimination and Allocation Learning Set Data with known classes Prediction Classification rule Data with unknown classes Classification Technique Class Assignment Discrimination
Learning set Bad prognosis recurrence < 5yrs Good Prognosis recurrence > 5yrs ? Good Prognosis Metastasis > 5 Predefine classes Clinical outcome Objects Array Feature vectors Gene expression new array Reference L van’t Veer et al (2002) Gene expression profiling predicts clinical outcome of breast cancer. Nature, Jan. . Classification rule
Learning set Predefine classes Tumor type B-ALL T-ALL AML T-ALL ? Objects Array Feature vectors Gene expression new array Reference Golub et al (1999) Molecular classification of cancer: class discovery and class prediction by gene expression monitoring. Science 286(5439): 531-537. Classification Rule
Components of class prediction • Choose a method of class prediction • LDA, KNN, CART, ....: Prediction model • Select genes on which the prediction will be base: Feature selection • Which genes will be included in the model? • Validate the model • Use data that have not been used to fit the predictor
Choose prediction model • Prediction methods • Fisher linear discriminant analysis (FLDA) and its variants (DLDA, Gene voting, CCP, ...) • Logistic classification • Nearest Neighbor • Classification Trees • Support vector machines (SVMs) • Neural networks • And many more …
Fisher linear discriminant analysis First applied in 1935 by M. Barnard at the suggestion of R. A. Fisher (1936), Fisher linear discriminant analysis (FLDA) consists of i. finding linear combinations x a of the gene expression profiles x=(x1,...,xp) with large ratios of between-groups to within-groups sums of squares - discriminant variables; ii. predicting the class of an observation x by the class whose mean vector is closest to x in terms of the discriminant variables.
Classification with SVMs Generalization of the ideas of separating hyperplanes in the original space. Linear boundaries between classes in higher-dimensional space lead to the non-linear boundaries in the original space. Adapted from internet
Nearest neighbor classification • Based on a measure of distance between observations (e.g. Euclidean distance or one minus correlation). • k-nearest neighbor rule (Fix and Hodges (1951)) classifies an observation x as follows: • find thek observations in the learning set closestto x • predict the class of x by majority vote, i.e., choose the class that is most common among those k observations. • The number of neighbors kcan be chosen by cross-validation(more on this later).
Classification tree • Binary tree structured classifiers are constructed by repeated splits of subsets (nodes) of the measurement space X into two descendant subsets, starting with X itself. • Each terminal subset is assigned a class label and the resulting partition of X corresponds to the classifier.
Classification trees Mi1 < 1.4 Node 1 Class 1: 10 Class 2: 10 Gene 1 no yes Mi2 > -0.5 Node 2 Class 1: 6 Class 2: 9 Node 3 Class 1: 4 Class 2: 1 Prediction: 1 yes no Gene 2 Mi2 > 2.1 Node 5 Class 1: 6 Class 2: 5 Node 4 Class 1: 0 Class 2: 4 Prediction: 2 Gene 3 Node 6 Class 1: 1 Class 2: 5 Prediction: 2 Node 7 Class 1: 5 Class 2: 0 Prediction: 1
Three aspects of tree construction • Split selection rule: • Example, at each node, choose split maximizing decrease in impurity (e.g. Gini index, entropy, misclassification error). • Split-stopping: The decision to declare a node as terminal or to continue splitting. • Example, grow large tree, prune to obtain a sequence of subtrees, then use cross-validation to identify the subtree with lowest misclassification rate. • The assignment: of each terminal node to a class • Example, for each terminal node, choose the class minimizing the resubstitution estimate of misclassification probability, given that a case falls into this node. Supplementary slide
Other classifiers include… • Support vector machines • Neural networks • Bayesian regression methods • Projection pursuit • ....
Aggregating predictors • Breiman (1996, 1998) found that gains in accuracy could be obtained by aggregating predictors built from perturbed versions of the learning set. • In classification, the multiple versions of the predictor are aggregated by voting.
Another component in classification rules:aggregating classifiers Classifier 1 Resample 1 Classifier 2 Resample 2 Training Set X1, X2, … X100 Aggregate classifier Classifier 499 Resample 499 Examples: Bagging Boosting Random Forest Classifier 500 Resample 500
Aggregating classifiers:Bagging Test sample Resample 1 X*1, X*2, … X*100 Tree 1 Class 1 Resample 2 X*1, X*2, … X*100 Tree 2 Class 2 Training Set (arrays) X1, X2, … X100 Lets the tree vote 90% Class 1 10% Class 2 Resample 499 X*1, X*2, … X*100 Tree 499 Class 1 Resample 500 X*1, X*2, … X*100 Tree 500 Class 1
Feature selection • A classification rule must be based on a set of variables which contribute useful information for distinguishing the classes. • This set will usually be small because most variables are likely to be uninformative. • Some classifiers (like CART) perform automatic feature selection whereas others, like LDA or KNN, do not.
Approaches to feature selection • Filter methods perform explicit feature selection prior to building the classifier. • One gene at a time: select features based on the value of an univariate test. • The number of genes or the test p-value are the parameters of the FS method. • Wrapper methods perform FS implicitly, as a part of the classifier building. • In classification trees features are selected at each step based on reduction in impurity. • The number of features is determined by pruning the tree using cross-validation.
Why select features • Lead to better classification performance by removing variables that are noise with respect to the outcome • May provide useful insights into etiology of a disease. • Can eventually lead to the diagnostic tests (e.g., “breast cancer chip”).
Why select features? Top 100 feature selection Selection based on variance No feature selection Correlation plot Data: Leukemia, 3 class +1 -1
Performance assessment • Before using a classifier for prediction or prognostic one needs a measure of its accuracy. • The accuracy of a predictor is usually measured by the Missclassification rate: The % of individuals belonging to a class which are erroneously assigned to another class by the predictor. • An important problem arises here • We are not interested in the ability of the predictor for classifying current samples • One needs to estimate future performance based on what is available.
Estimating the error rate • Using the same dataset on which we have built the predictor to estimate the missclassification rate may lead to erroneously low values due to overfitting. • This is known as the resubstitution estimator • We should use a completely independent dataset to evaluate the classifier, but it is rarely available. • We use alternatives approaches such as • Test set estimator • Cross validation
Performance assessment (I) • Resubstitution estimation: Compute the error rate on the learning set. • Problem: downward bias • Test set estimation: Proceeds in two steps • Divide learning set into two sub-sets, L and T; • Build the classifier on L and compute error rate on T. • This approach is not free from problems • L and T must be independent and identically distributed. • Problem: reduced effective sample size
Diagram of performance assessment (I) Classifier Training Set Resubstitution estimation Performance assessment Training set Test set estimation Classifier Independent test set
Performance assessment (II) • V-fold cross-validation (CV) estimation: Cases in learning set randomly divided into V subsets of (nearly) equal size. Build classifiers by leaving one set out; compute test set error rates on the left out set and averaged. • Bias-variance tradeoff: smaller V can give larger bias but smaller variance • Computationally intensive. • Leave-one-out cross validation (LOOCV). • Special case for V=n. • Works well for stable classifiers (k-NN, LDA, SVM)
Diagram of performance assessment (II) Classifier Training Set Resubstitution estimation (CV) Learning set Cross Validation Classifier Training set Performance assessment (CV) Test set Test set estimation Classifier Independent test set
Bad Good Case studies Learning set Classification Rule Reference 1 Retrospective study L van’t Veer et al Gene expression profiling predicts clinical outcome of breast cancer. Nature, Jan 2002. . Feature selection. Correlation with class labels, very similar to t-test. Using cross validation to select 70 genes Reference 2 Cohort study M Van de Vijver et al. A gene expression signature as a predictor of survival in breast cancer. The New England Jouranl of Medicine, Dec 2002. 295 samples selected from Netherland Cancer Institute tissue bank (1984 – 1995). Results” Gene expression profile is a more powerful predictor then standard systems based on clinical and histologic criteria • Agendia (formed by reseachers from the Netherlands Cancer Institute) • Has started in Oct, 2003 • 5000 subjects [Health Council of the Netherlands] • 5000 subjects New York based Avon Foundation. • Custom arrays are made by Agilent including • 70 genes + 1000 controls Reference 3 Prospective trials. Aug 2003 Clinical trials http://www.agendia.com/
Van’t Veer breast cancer study study Investigate whether tumor ability for metastasis is obtained later in development or inherent in the initial gene expression signature. • Retrospective sampling of node-negative women: 44 non-recurrences within 5 years of surgery and 34 recurrences. Additionally, 19 test sample (12 recur. and 7 non-recur) • Want to demonstrate that gene expression profile is significantly associated with recurrence independent of the other clinical variables. Nature, 2002
Predictor development • Identify a set of genes with correlation > 0.3 with the binary outcome. Show that there are significant enrichment for such genes in the dataset. • Rank-order genes on the basis of their correlation • Optimize number of genes in the classifier by using CV-1 Classification is made on the basis of the correlations of the expression profile of leave-out-out sample with the mean expression of the remaining samples from the good and bad prognosis patients, respectively. N. B.: The correct way to select genes is within rather than outside cross-validation, resulting in different set of markers for each CV iteration N. B. : Optimizing number of variables and other parameters should be done via 2-level cross-validation if results are to be assessed on the training set. The classification indicator is included into the logistic model along with other clinical variables. It is shown that gene expression profile has the strongest effect. Note that some of this may be due to overfitting for the threshold parameter.
van de Vuver’s breast data(NEJM, 2002) • 295 additional breast cancer patients, mix of node-negative and node-positive samples. • Want to use the predictor that was developed to identify patients at risk for metastasis. • The predicted class was significantly associated with time to recurrence in the multivariate cox-proportional model.
Acknowledgments • Many of the slides in this course notes are based on web materials made available by their authors. • I wish to thank specially • Yee Hwa Yang (UCSF), • Ben Boldstat, Sandrine Dudoit & Terry Speed, U.C. Berkeley. • The Bioconductor Project • "Estadística I Bioinformàtica" research group at the University of Barcelona