Download
1 / 27
270 likes | 398 Views
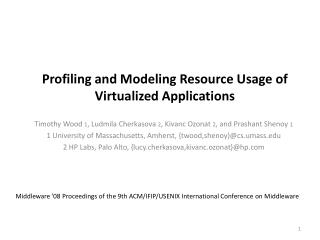
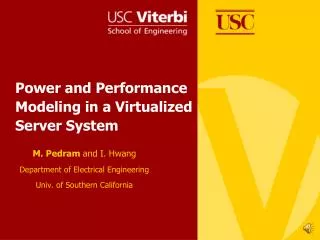
Power and Performance Modeling in a Virtualized Server System. M. Pedram and I. Hwang Department of Electrical Engineering Univ. of Southern California. Outline. Study and its purpose Motivation Concepts and Definitions Methodology Experimental system setup Simulation results

E N D
Power and Performance Modeling in a Virtualized Server System M. Pedram and I. Hwang Department of Electrical Engineering Univ. of Southern California
Outline • Study and its purpose • Motivation • Concepts and Definitions • Methodology • Experimental system setup • Simulation results • Power modeling • Performance modeling • Power-performance tradeoff analysis
Motivation • Modern data centers consume large amounts of energy and put a lot of stress on the aging Power Grid • Average utilization level of enterprise servers in a typical datacenter is quite low • Service level agreements (SLAs) between clients and datacenter operators are critically important esp. for hosting centers • Accurate models of power and performance are essential for dynamic resource provisioning and allocation as well as power/thermal management
Virtualization • Virtualization is disassociating the tight bond between software and hardware by introducing a hypervisor between the OS and hardware • One can then use the same hardware to serve up the needs of the different software servers: Oracle, MS SQL Server, Exchange, Dynamics CRM, etc. • It is also possible to run different operating systems so one could run MS SQL Server 2008 on Windows 2008 Server and run Oracle on Linux all running on the same hardware • By doing this, the resources will be better utilized since we can easily add/migrate virtual machines • Examples include Microsoft Hyper-V, VMware ESX Server 3.5, Linux Xenhypervisor
Concepts and Definitions • Processor: An integrated circuit containing possibly multiple cores, caches, memory and other I/O interfaces • Hypervisor (Virtual Machine Monitor): Essentially a hardware platform virtualization software with which one can run different OS on the same hardware at the same time • VMM is responsible for CPU scheduling and memory partitioning of the various virtual machines running on the hardware device; Also it is the software that allocates basic machine resources including CPU time and memory • Fully-virtualized: A virtual machine not aware of its virtualization (needs no OS support, is fully transparent but has high overhead) • Para-virtualized: A virtual machine running on a hypervisor that is aware of it being virtualized
Definitions Cont’d • Domain 0, the Privileged Domain (Dom0): Privileged guest running on the hypervisor with direct hardware access and guest management responsibilities • Multiple Domain U, Unprivileged Domain Guests (DomU): Unprivileged guests running on the hypervisor; they have no direct access to hardware • Virtual machine (VM): Same as a domain • (Physical) CPU : A physical core in a processor • Virtual CPU: (one or more per VM) – maybe a process, request, or job that must run on a CPU • Each CPU manages a local run queue of runnable VCPUs; This queue is sorted by VCPU priority • CPU utilization: Total of utilization of all CPUs in the system • E.g., 400% for 4 physical CPUs that are fully utilized
Workload Generator • Generate tasks for load the system • TCP/IP based structure • Mimic web-based services • Schedule various types of tasks • CPU/IO/MEM bound, inter-arrival time, etc
Experimental System Setup • Model: Intel Dual Xeon E5400 series; Code Name: Harpertown • Two processor system; Each processor is quad-core • The chip supports two frequency levels: 2.0GHz, 2.33GHz • Two cores in a socket must run the exact same frequency Each processor is equipped with "Demand Based Switching" power management We cut the (12V) power line for the processor chip and measure DC power dissipation Processors Voltage regulator
Test Cases: Taxonomy • Variables:# of vCPUs, set of active pCPUs, and their freq. levels
Power Measurement Results • Linear model • Cluster 1: cases 1-5, 11 • Low frequency • Cluster 2: cases 6-10, 12 • High & mixed frequency
Power Analysis • Observation 1: When all active CPUs are running at the low frequency level, the processor power dissipation is nearly independent of which subset of CPUs is used by the running domain (cf. cases 1 through 5, and 11) • Even if some of inactive CPUs are running at ahigh frequency, they do not make any difference (case 3 vs. case 11) • Core consolidation is ineffective for power saving
Power Analysis Cont’d • Observation 2: When all active CPUs are running at high frequency, processor power dissipation is only weaklydependent on the subset of CPUs used by the running domain (cf. cases 6 through 10) • Power slope increases as # of pCPUs decreases • There is a small change in power offset, but this is mainly causedby regression error • Core consolidation is ineffective for power saving
Power Analysis Cont’d • Observation 3: Power dissipation for the case where active CPUs are running at different frequency levels is similar to that of the case that has the same # of active CPUs all running at the high frequency level (cf. cases 9 and 12) • Power slopes are nearly the same • Only small difference in the power offsets
Power Analysis Cont’d • Observation 4: The idle power dissipation of the processor chip is somewhat higher for the higher frequency level (cf. cases 1-5 vs. 6-10)
Power Analysis Cont’d • Observation 5: Processor consolidation is helpful in reducing power dissipation (cf. case 17 vs. case 18) • case 17 = cases 8 & 9 • Processor 2 is not being used, so it only increases the offset power • case 18 = case 10 • Settings of the two processors are identical • The maximum possible utilization of case 18 is 200%, which is twice that of case 10
Power Model • Linear model • Cluster 1: cases 1-5, 11 • Low frequency • Independent of parameters • Cluster 2: cases 6-10, 12 • High & mixed frequency • Dependenton parameters Low f High f (for same λ)
Power Model Cont’d • Power dissipation as a function of the frequency level • Exclude offset because no difference in power offsets of cases 1,6 • P(case6) / P(case1) = 0.088 / 0.046 = 1.913 • Freq(case6) / Freq(case1) = 2.33 / 2.0 = 1.165 Low f High f (for same λ)
Unified Power Model – High Freq. • Additional required parameter • # of active CPUs
Extension to Multi-Processors • Estimated from power model • Measured from experimental results • Linear relationship between ‘pwr’ and ‘# of processors’ under the same utilization level • a*= average of the slopes • b*= sum of the offsets
Performance Model • Queuing theory result • Average wait time: • Our performance model:
Performance Analysis • Observation 1: At the same normalized utilization level, response time of cases with smaller number of active CPUs is much higher than response times of cases with larger number of active CPUs (cases 5 & 10 vs. cases 1 & 6) • norm util = total util / (# of active CPUs)
Performance Analysis Cont’d. • Observation 2: When # of vCPUs is larger than # of pCPUs, responsetime increases (cf. case 5 vs. case 13, or case 10 vs. case 14) • # of vCPUscan be a parameter of the model
Pareto Surface • Cost function • Energy * resp. time / task • Select best parameter • One must choose the best parameters for different levels of load intensity or CPU utilization levels • Either case 1 or 6 is the best one (cases w/o consolidation) • CPU consolidation in a physical machine is not a good idea from a power savings perspective (but processor consolidation is effective)
Conclusion • Accurate power/performancemodels for CPUs and servers in a virtualized computer system were derived through extensive simulations and hardware measurements • These models can be used for doing a better power and performance tradeoff analysis or dynamic management • Future work will include getting power/performance models for a more general virtualized system (multi-tiered service or multi-guest domains) using more advanced architectures (multi-core processor chips with hardware assists for virtualization)