Download
1 / 11
120 likes | 276 Views
Phenotype Prediction by Integrative Network Analysis of SNP and Gene Expression Microarrays. Hsun-Hsien Chang 1 , Michael McGeachie 1,2 1 Children’s Hospital Informatics Program, Harvard-MIT Division of Health Sciences and Technology, Harvard Medical School

E N D
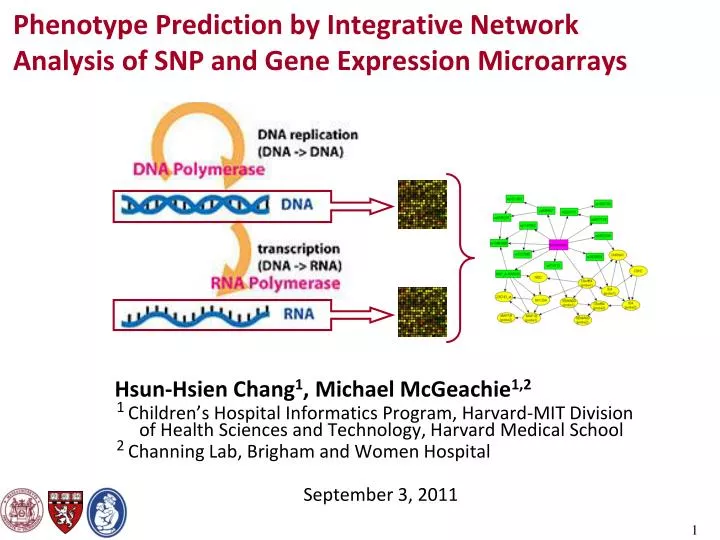
Phenotype Prediction by Integrative Network Analysis of SNP and Gene Expression Microarrays Hsun-Hsien Chang1, Michael McGeachie1,2 1 Children’s Hospital Informatics Program, Harvard-MIT Division of Health Sciences and Technology, Harvard Medical School 2 Channing Lab, Brigham and Women Hospital September 3, 2011
Genetic Information Flows from DNA to RNA • Central dogma of molecular biology. • Research goals: • Decipher how genetic variants influence RNA transcript expression, leading to disease formation. • Create clinical tools to perform diagnosis & prognosis, design treatment strategies, etc.
Measure Genetic Variants and RNA Abundance by Microarrays • Genetic variants are measured by single nucleotide polymorphisms (SNPs). • Modeled by discrete (multinomial) random variables. • Microarrays can assess 500K SNPs in parallel. • RNA abundance is measured by transcriptional expression levels. • Modeled by continuous (log-normal) random variables. • Microarrays can assess 50K transcripts in parallel.
Identify SNP-Transcript Dependence • Challenges: • Need an intelligent method to compare pairs of 500K SNPs and 50K transcripts. • Need a network analysis to capture molecular interactions between SNPs and transcripts. High expression level Low expression level Medium expression level
Filter by Phenotypes (Bayes factor) Filter by Phenotypes (Bayes factor) Reduce Dimensionality by Phenotypes SNPs microarrays (discrete variables) expression microarrays (continuous variables)
Model SNP-Transcript Dependence S1 A SNP can be influenced by other SNPs. Reduced SNPs data SM G1 A transcript can be influenced by SNPs and other transcripts. Reduced expression data GN
Pheno Interplay of Phenotypes, SNPs, and Transcripts • Network analysis is performed on the reduced data set. • For each variable, find the set of modulating variables with the highestlikelihood . • Implement a greedy search algorithm to search the best network.
Pediatric Acute Lymphoblastic Leukemia (ALL) • Mutation of lymphoblasts leads to acute lymphoblastic leukemia (ALL). • Two types of ALL have different responses to chemotherapies: • B-cell precursor ALL (BCP-ALL) • common ALL (C-ALL)
A SNP-Transcript Network Distinguishes Pediatric Acute Lymphoblastic Leukemia • Database from GEO with access # GSE10792. • 28 patients; 8 with BCP-ALL and 20 with C-ALL. • Genotyped at 100k SNPs by Affymetrix Human Mapping 100K Set microarrays. • Expression patterns of 50k genes were profiled using Affymetrix HG-U133 Plus 2.0 platforms. • 96% phenotype classification accuracy.
Conclusions • Use phenotypes to reduce data dimensionality. • Capture genetic flow by modeling SNP-transcript dependence networks. • Create phenotype dependent SNP-transcript networks. • Apply the analysis to pediatric acute lymphoblastic leukemia.