Download
1 / 7
70 likes | 76 Views
Predicting chromosome instability in cancer using gene expression data and location information. Bioinformatics for Genomic Medicine 2006 04-24 Do Kyoon Kim. Introduction. Microarray data High throughput data contains many information Integration of data & knowledge Better outcome?.

E N D
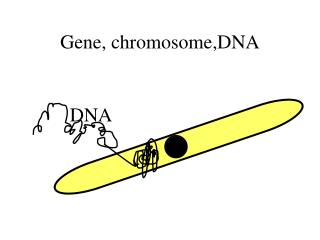
Predicting chromosome instability in cancer using gene expression data and location information Bioinformatics for Genomic Medicine 2006 04-24 Do Kyoon Kim
Introduction • Microarray data • High throughput data contains many information • Integration of data & knowledge • Better outcome?
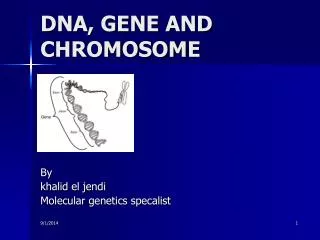
Introduction • Chromosome instability in cancer • 세포 내 유전체의 안정성은 유전체 복제(replication)와 분열(mitosis)의 각 단계들이 상호 의존적인 연속과정으로 순차적으로 조절되어 유지 • 세포주기의 조절에는 사이클린, 사이클린 의존성 키나아제 등의 단백질 활성화 효소에 의해서 조절되어 지는데 이러한 조절 기능에 이상이 생기면 정상세포가 암 세포화 될 수 있다고 알려져 있음 • 암세포에서는 세포의 핵을 구성하는 염색체의 불안정성 (chromosome instability)이 나타나는데 이는 암세포와 정상세포를 구별 하는 중요한 특징의 하나임
Problem definition • Detect gene expression pattern by chromosome instability in cancer using microarray gene expression data and location information (genes within the chromosomal region) • Add additional function to the ChromoViz for visualization if possible
Method • Clustering each samples by number of chromosome unit - Chromosome unit: genes in user defined distance on chromosome Normal patient A cancer B cancer C cancer
Method 2. Test membership similarity between chromosome unit and cluster using hypergeometric distribution Normal patient A cancer B cancer C cancer 1 2 1 2 1 2 3 1 2 4 3 4 3 4 4 3
Method 3. Compare to each graphs or visualize expression data onto chromosome with associated annotation of location information